The National Capital Region Transportation Planning Board (TPB) has a long history of surveying aviation passengers at the region’s three major commercial airports: Baltimore/Washington International Thurgood Marshall Airport (BWI), Washington Dulles International Airport (IAD), and Ronald Reagan Washington National Airport (DCA). For more than four decades, the TPB has used survey results to understand more about the purpose of air passengers’ travel, how they traveled to the airport, why they chose a particular airport, and other important information and insights about the region’s air passengers.
An integral part of TPB’s Continuous Airport System Planning (CASP) program, carried out under the oversight of TPB’s Aviation Technical Subcommittee, the Regional Air Passenger Survey is an at-gate intercept survey that provides origin and destination information considered essential for developing regional travel demand models, airport ground access transportation planning, terminal and airport facility planning, and forecasting air passenger demand.
“The Regional Air Passenger Survey provides the most comprehensive picture of commercial air travel in the Washington/Baltimore region and its three major airports – BWI, Dulles, and National – shedding light on the purpose of air travel, ground transportation to the airport, and information about passenger characteristics and their preferences and behavior,” remarked Dr. Kenneth Joh, TPB Principal Statistical Survey Analyst.
Survey overview
Beginning with paper questionnaires in 1981, the survey adopted electronic data collection in the most recent survey with interviewers approaching departing air passengers at randomly selected gates. Passengers were asked to take the survey on handheld tablets or scan a QR code to take the survey online on their personal mobile devices. The most recent survey was conducted over a two-week period—with a one-week resurvey period--in October 2023, marking the first time the survey had been conducted since the coronavirus pandemic.
In total, 486 flights were surveyed, yielding 9,599 valid responses from passengers at all three airports. The air passenger survey’s percentages were weighted based on annual enplanements, reflecting air passengers for an annual period rather than just those passengers who were surveyed during the October period.
The number of enplanements, or passenger boardings, at all three airports was about 421,000 higher than in 2019, with a total of 38.2 million boardings in 2023. Looking at the region as a whole, 79 percent of enplanements are of local origin versus 21 percent for connecting flights. Both BWI and DCA experienced slight decreases in boardings of trips of local origination, whereas IAD experienced an increase from 71 percent to 76 percent since 2019.
Who’s traveling, where, and why
Among the region’s airports, non-resident passengers (i.e., those who live outside the Washington and Baltimore region) continue to outnumber resident passengers, although the share of resident passengers has been slowly increasing. Reagan National Airport saw the greatest share of non-resident passengers, who comprise 67 percent. At BWI, non-residents were 53 percent of air travelers, and at Dulles, non-residents made up 46 percent of air travelers. Travelers ages 45-54 flew the most of any age group through the region’s airports, followed closely by 35–44-year-olds and 25–34-year-olds.
As might be expected, the region has experienced a decline in business travel due to the pandemic and post-pandemic factors. In 2017, 38 percent of surveyed trips were for business-related purposes, dropping to 30 percent in 2023. Among non-business travel, vacation is the trip purpose that has had the greatest increase, reflecting a surge in post-pandemic vacation travel.
Getting to the airport
In addition to demographics, the air passenger survey included questions about travel to the airport—where the ground trip began, what travel mode the passenger used to reach the airport, whether there were differences in travel mode depending on whether the trip started from home or non-home locations, whether an individual is a resident or non-resident, and whether the air travel was for business or non-business reasons.
For all airports, the largest share of air passengers started their ground trip to the airport from a private residence, followed by a hotel/motel. Over 70 percent of travelers flying out of BWI and Dulles began their trip at a private residence in 2023 compared to 49 percent of DCA travelers. While the breakdown of trip origin locations remained steady since 2017, the share of Dulles travelers departing from a private residence increased between 2017 and 2023.
Regionwide, private car is the most common way to reach the airports. In 2023, 45 percent of trips were by car. Following private car, Transportation Network Companies, or TNCs, (Lyft, Uber) were the second most used mode, which nearly doubled in share from 14 percent of trips in 2017 to 26 percent of trips in 2023. The share of passengers who traveled to the airport by private car was highest at BWI, followed by IAD and DCA passengers. DCA passengers used TNCs most frequently (37 percent), followed by IAD and BWI.
The share of passengers who used transit was notably higher at DCA (12 percent) compared with IAD and BWI passengers (refer to “Passenger Mode Access by Airport – 2023” chart below). At the time of the survey and consistent with national trends, public transportation ridership in the region was still lower than pre-pandemic levels. As a result, it is noteworthy that IAD experienced an increase in the share of transit ground access trips compared to prior surveys because of the opening of Metrorail’s Silver Line extension to Loudoun County.
Passenger Mode Access by Airport - 2023
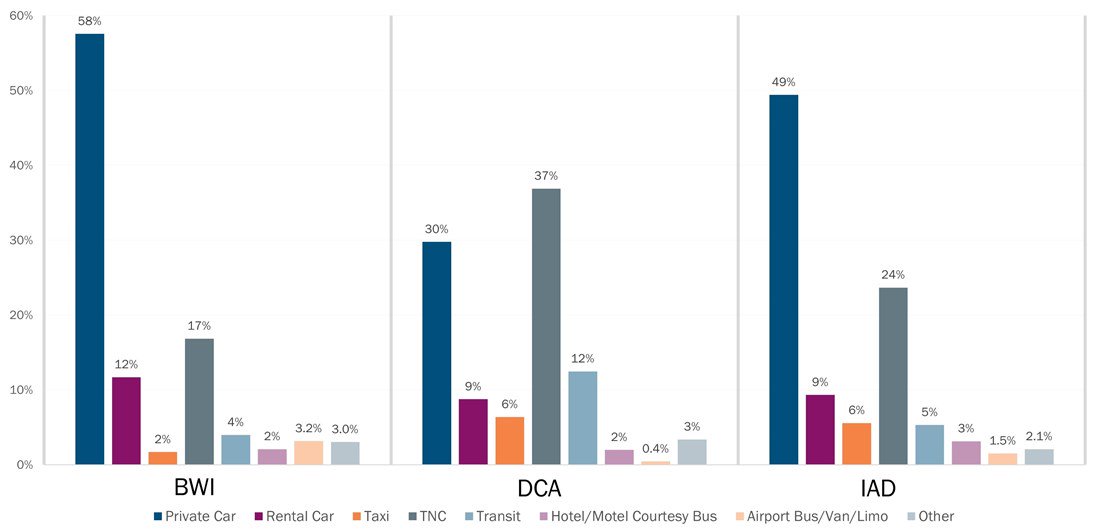
(COG/TPB)
Which airport? Passengers share their reasons for choosing DCA, BWI, and IAD
As part of the survey, passengers were asked to choose the top reasons for flying out of their airport. Response options included:
- Closest airport
- Only airport with direct/non-stop flight to destination
- Better public ground transportation
- More convenient flight times
- Only airport serving market
- Frequent flyer with a specific airline
- Less expensive airfare
- Better access roads and parking
- Other
At the regional level, proximity to an airport is the primary reason why travelers selected their airport. The largest share of passengers chose “closest airport” as the top reason (45%), although this percentage has decreased since 2019. Other top reasons indicated by air passengers included more convenient flight times and less expensive airfare.
On an individual airport basis, better public ground transportation access was selected more often by DCA flyers. Fifteen percent of BWI flyers chose “less expensive flights” —the highest among the three airports. IAD travelers selected “Only airports with direct flights” and “Only airport serving market” more often than flyers at DCA and BWI, reflecting, in part, the number of international flights departing from Dulles.
Reason for Airport Choice - 2023
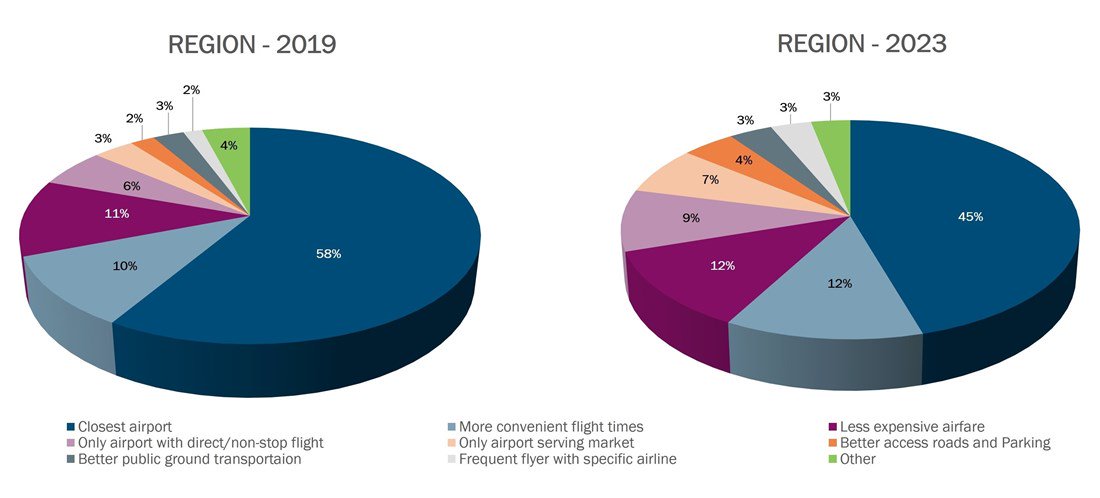
(COG/TPB)
Takeaways
The results of the 2023 Regional Air Passenger Survey provide a useful look at how air passengers who live in the region and visitors from outside the region are making airport travel decisions in a still-evolving, post-COVID period. Takeaways from the 2023 survey include:
- The largest share of air passengers chose their airport because it was the closest airport.
- Regionwide, convenience was the most important reason why travelers chose their mode of access, followed by cost and reliability.
- The share of passengers who typically traveled to the airport by private or rented car decreased slightly in the post-pandemic period while the share of passengers who typically used taxi or ride-hail increased in the region.
In addition to this summary, the September 18 TPB meeting page includes a general findings memo and presentation that offer more information on the survey (Item 8).
Kenneth Joh, Ph.D., Principal Statistical Survey Analyst, Timothy Canan, Planning Data and Research Program Director, and Olga Perez Pelaez, Planning Program Specialist, contributed to this summary.