The TPB has just released its latest technical memorandum, the 2022 Technical Update: Assessing Distribution of Bus Transit Service for Equity. This past year has seen restoration of local bus service within the region to near pre-coronavirus pandemic levels, as well as restructuring of both WMATA Metrobus service and the City of Alexandria DASH service, and the equity analysis update provides an opportunity to see how access to bus transit is functioning under late pandemic conditions.
The purpose of the research and analysis is to understand the differences in ability to reach and use local bus service in the region relative to population characteristics and job type. Access is analyzed based on a one-quarter mile buffer around stops with 15-minute or better service frequencies during weekday A.M. and P.M. peak periods and 30-minute frequencies midday on Saturdays. Data examined for service equity include:
- Total population, percent of regional non-Hispanic white population, and percent of regional people of color population
- Population in low-income households
- People with disabilities
- People who speak languages other than English at home
- Total households
- Zero/one-car households
- Two or more-car households
- Total jobs, low-wage jobs, low-wage workers, and essential jobs
Key takeaways
- 60 percent of the total population in the TPB region is within one-quarter mile of fixed-route bus service.
- 65 percent of people of color and 74 percent of low-income households are within a one-quarter mile of bus stops.
- However, only 35 percent of the total population of the TPB region has access to 15-minute or better service during the A.M. peak period. As a result, a low percentage of access to frequent service for all groups is a concern for quality of life and jobs access.
Research and analysis data sources
Research was conducted by mapping the 2020 American Community Survey (ACS) 5-year estimates for population and demographics, the 2019 Longitudinal Employer-Household Dynamics (LEHD) employment figures, and the General Transit Feed Specification (GTFS) data. GTFS allows public transit agencies to publish their schedule and real-time data into readily usable formats by software applications, sharing information on schedules, fares, and geography. The real-time component includes bus arrival predictions, vehicle positions within the route network, and service advisories.[1]
For those who would like a closer look at the job accessibility and gap analyses, the Assessing Distribution of Bus Transit Service for Equity technical memorandum is available in Agenda Item 9 on the October 2022 TPB meeting page.
Additional resources
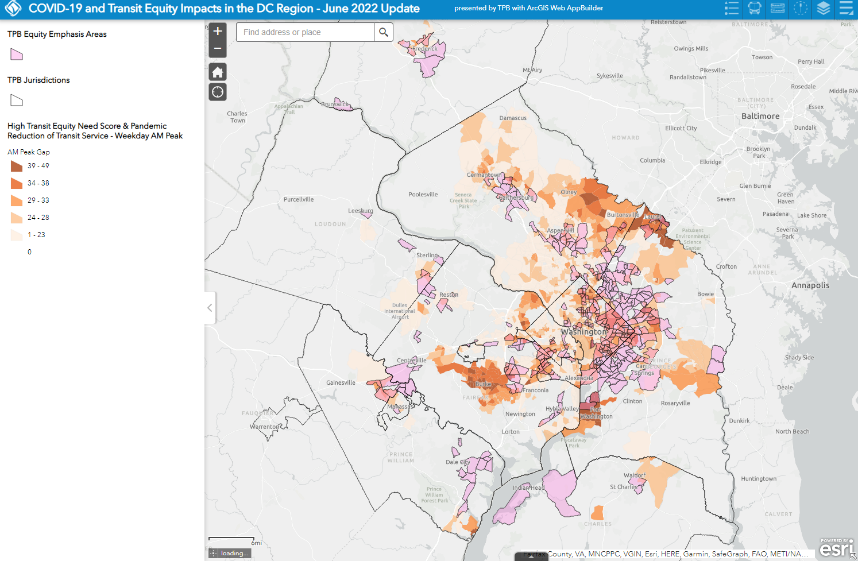
The GIS webmap tool features multiple layers. In addition to a base layer of the region and location of Equity Emphasis Areas (EEAs), planners can view current local bus routes, jobs accessible within a 45-minute bus trip from all points or the region, and pandemic impacts (e.g., service frequency and route revenue hours). The following screenshot offers an example of the layers available, showing locations with high transit service needs that experienced reduction in weekday A.M. peak service during the pandemic.
(TPB)