As metropolitan Washington’s population grew over the last decade it also became even more diverse, according to 2020 U.S. Census data analyzed by COG. COG’s new report, Our Changing Region, reveals several takeaways about the region’s population, its diversity, and how it is distributed across the region’s jurisdictions, using maps and analysis.
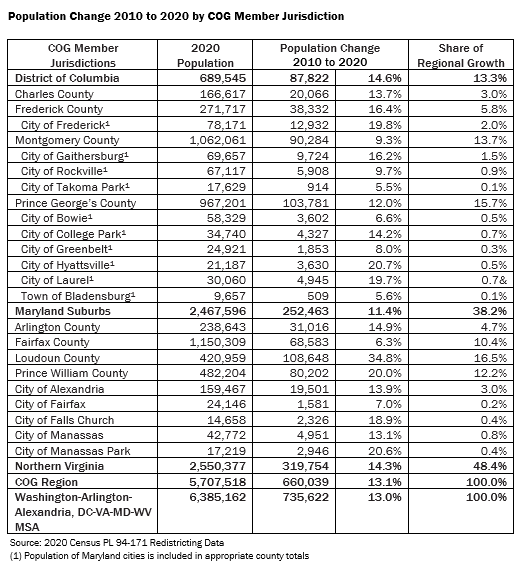
- The region added more than 660,000 people between 2010 and 2020 – an increase of 13 percent—and no area jurisdictions recorded a population loss.
Fairfax County is the most populous jurisdiction in the region with 1,150,309 people, but Loudoun County grew the most (by approximately 35 percent) and recorded the largest share of the region’s growth (16 percent).
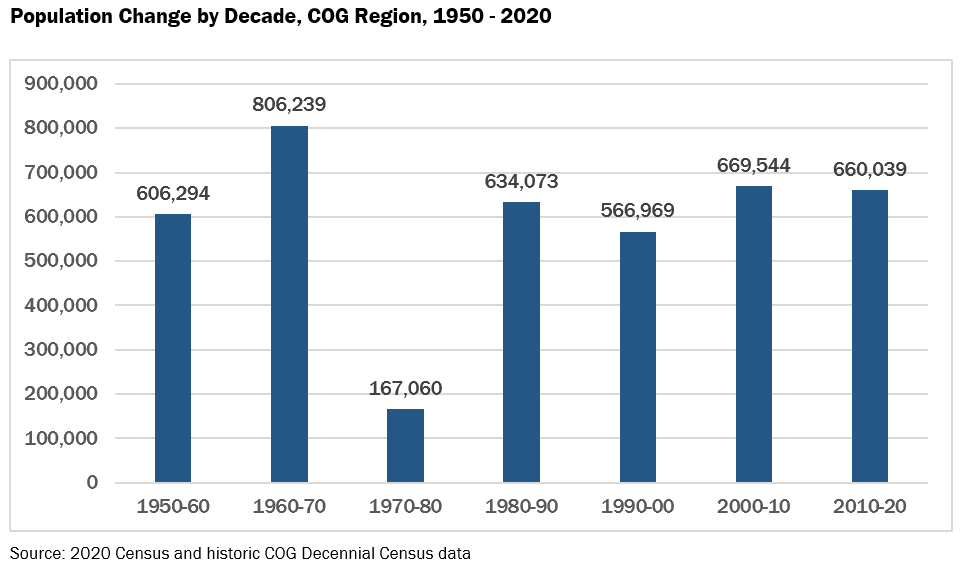
- The region’s growth has been steady over the last 70 years.
The region experienced the most growth between 1960 and 1970 and 2000 and 2010, with the least amount of growth between 1970 and 1980. The past decade, between 2010 and 2020, ranks third for population growth.
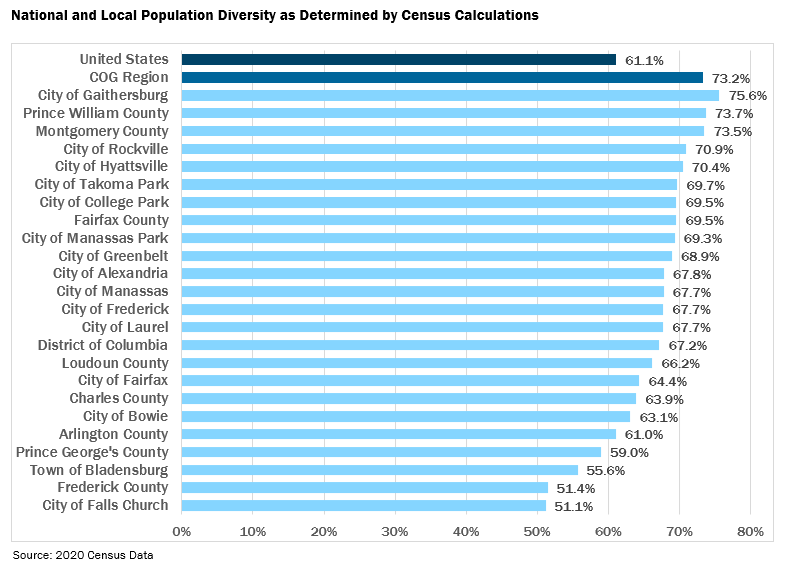
- The region is incredibly diverse; its diversity index (73.2 percent), or the representation and relative size of different racial and ethnic groups within the population, is higher than the nation’s (61.1 percent).
Further, nearly all COG jurisdictions meet or exceed the national measure for population diversity.
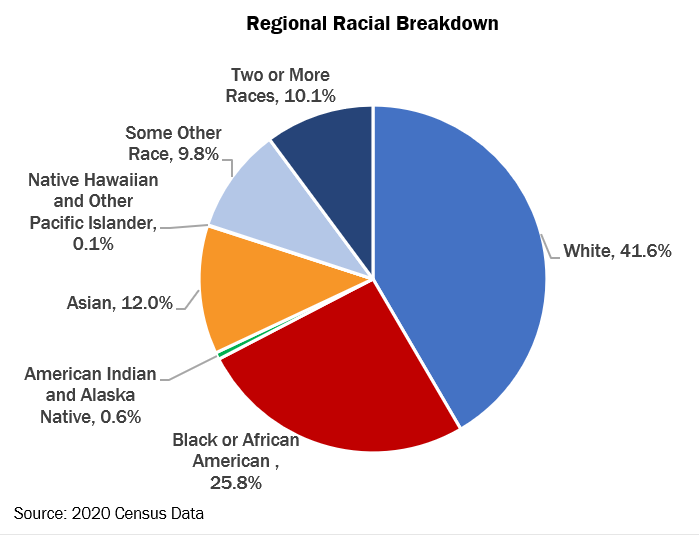
- The District of Columbia, and jurisdictions in suburban Maryland and Northern Virginia vary widely in their respective proportions of each racial group, but overall, the region became more diverse between 2010 and 2020.
More than half of the region’s residents identify as Black or African American (25.8 percent), Asian (12 percent), American Indian and Alaska Native (.6 percent), Native Hawaiian or Pacific Islander (.1 percent), some other race (9.8 percent), or two or more races (10.1 percent). The white population comprised less than half of the region’s total in 2020. And, each jurisdiction in the region saw an increase in its Hispanic and Latino population—the region had an overall increase of 287,384 persons or 39 percent over 2010—but not nearly as much growth as seen in the 2000-2010 period.
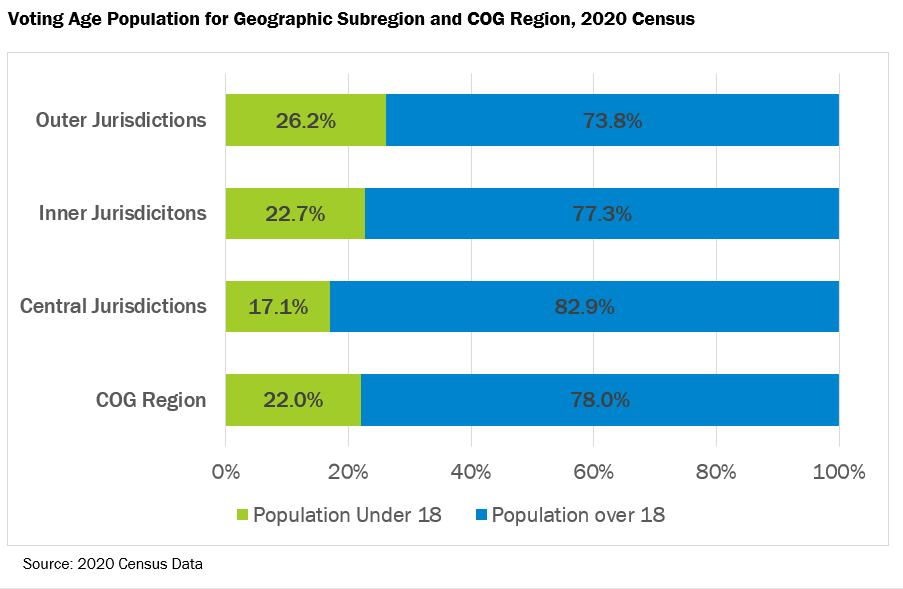
- The population is mostly made up of those 18 years or older.
Seventy-eight percent of the region’s population is 18 years or order. The region’s outer suburbs have the highest proportion of people under age 18 (26 percent), while the region’s core has the smallest portion (17 percent).
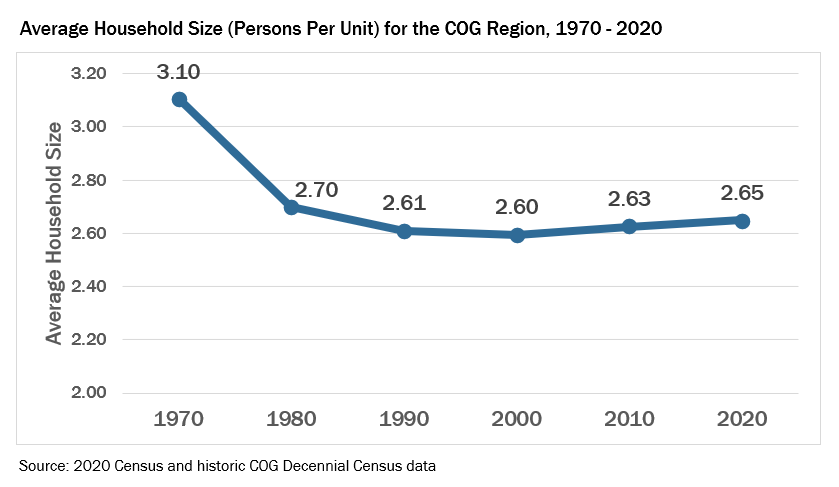
- Average household size in the region has increased slightly with each Census since 2000.
After falling dramatically since 1970, average household size (people per dwelling) increased slightly over the last couple decades—now at 2.65 persons per unit—reflecting the growing diversity of the population, with historically larger family sizes, and more multi-generational households.
Census data helps provide a clearer picture of the region, informing many facets of COG’s work alongside its member governments.
For example, throughout the last year, COG and its members have been considering how to prioritize and invest in communities who have been traditionally underserved as the region responds to and recovers from COVID-19, and shifts its attention to 2030 and beyond. In October, the COG Board of Directors approved new planning principles, which include prioritizing approximately 350 Equity Emphasis Areas—census tracts with high concentrations of traditionally underserved groups.
MORE: Our Changing Region: Highlights from the 2020 Decennial Census