The TPB’s household travel survey, the Regional Travel Survey (RTS), collected detailed demographic and travel behavior information from about 16,000 randomly selected area households. The RTS, conducted in 2017/2018, continues to provide planners and decision makers with valuable information about regional travel patterns and trends for all work and non-work trips.
The results of the RTS are also shedding light on thought-provoking questions about travel in our region. Despite the impacts of COVID-19 on travel, the RTS data and findings are still relevant and important as they will provide a point of comparison with a post-pandemic “new normal.”
While sharing the preliminary results from the RTS, we asked regional stakeholders, including local governments and transit agencies, to submit lingering questions that the RTS might help inform. Based on the questions received, staff took a deeper dive in the RTS and conducted an in-depth analysis.
We found that the answers to many of these questions can tell us a lot about our transportation system, including equity, in our region, particularly those questions listed below related to telework and high-capacity transit, characteristics of peak and off-peak travel, and the interaction of the use of personal vehicles and transit.
This information can help us better understand travel behavior patterns and how to best plan and serve our region in the future. Beyond the topics featured in this article which center around a theme of equity, the RTS In-Depth Analysis also explores travel patterns for low-income households, work start and end times, late-night travel modes, school trips, and much more. TPB News will cover some of these remaining topics in the coming months.
Topics Covered in this Article:
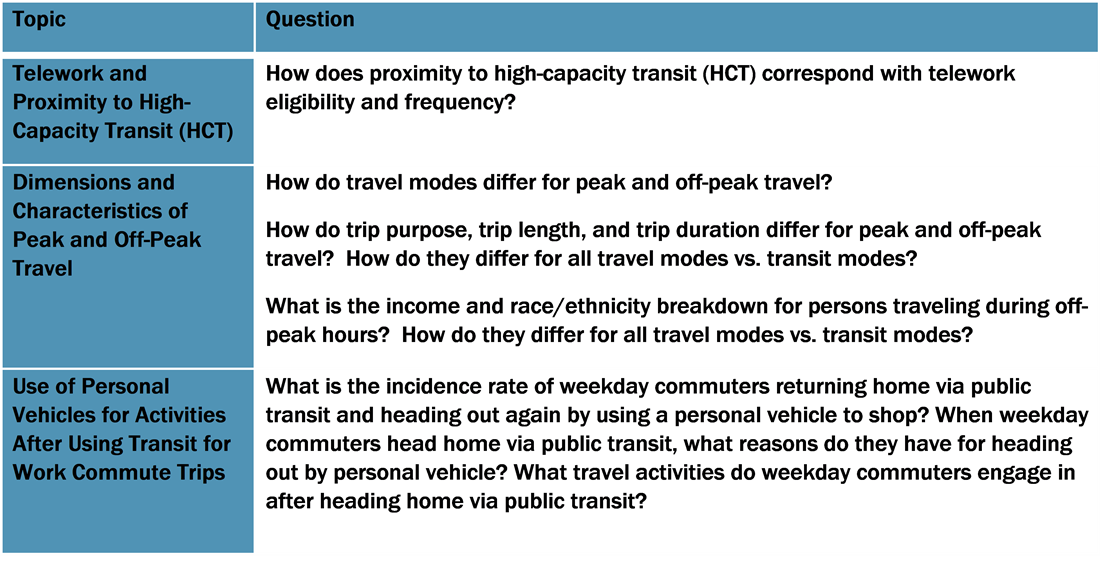
Telework and Proximity to High-Capacity Transit (HCT) Stations
We examined how proximity to high-capacity transit (HCT) stations, or areas around Metrorail, commuter rail, light rail, streetcar, and bus rapid transit stations, corresponds with telework prevalence.
We started by determining if a respondent lived or worked within a half-mile or a ten-minute walk on average of a HCT station. We considered both telework eligibility, workers with positions that can be performed remotely and with employers who offer this benefit, as well as telework frequency. We found that:
- Workers living or working within a half-mile of HCT stations have much higher telework eligibility than workers living or working outside of a half-mile of HCT stations. Workers both living and working within a half-mile of HCT stations have the highest telework eligibility, however, workers neither living nor working within a half-mile of HCT stations, have the lowest telework eligibility.
- Workers from households earning less than $50,000 have much lower telework eligibility than workers from households earning $50,000 or more, regardless of the proximity to high-capacity transit stations; however, the relationship between the proximity to high-capacity transit and the telework eligibility is similar for both household income groups.
- For telework frequency, workers who either live and/or work within a half-mile of HCT stations are more likely to telework one day per week than persons who live and/or work outside of a half-mile of HCT stations. Conversely, workers who work and/or live outside a half-mile of HCT stations are more likely to telework five or more days a week than persons who live and/or work within a half-mile of HCT stations.
These findings suggest that areas around HCT stations have higher telework prevalence. This could partially reflect the type of employers that locate near HCT stations, as transit-focused areas tend to also attract employers who allow teleworking (i.e., white collar jobs).
Workers living further away from transit stations, especially in the outer suburbs, are more likely to endure a daily commute that is not as feasible by transit and less likely to enjoy teleworking privileges. This underscores a spatial mismatch between residential location and jobs and the importance of promoting more teleworking options for workers in the region.
Dimensions and Characteristics of Peak and Off-Peak Travel
We examined peak and off-peak travel, specifically how travel modes, trip purpose, trip length, and trip duration differ for peak and off-peak travel for both work and non-work trips. We defined peak commute hours as 5:30 – 9:30 A.M. and 3:00 – 7:00 P.M. on weekdays. We also examined how trip length and trip duration differed for peak and off-peak trips. Finally, we looked at differences in travel mode for off-peak and peak travel by household income. We found that:
- Bus/rail transit, school bus, and bike trips are more likely to be taken during peak hours.
- Travel to work and school were more prevalent during peak hours.
- Trip lengths and durations are generally longer during peak hours compared with off-peak hours.
- Transit trips tend to be further in distance than other travel modes.
- Lower income households are more likely to take bus transit and taxi/ridehail trips for both peak and off-peak travel.
These findings suggest that most people in the region travel to work and school during typical commute hours and that public transit carries a significant share of peak-hour trips. Outside of peak commute hours, trips by private vehicle and taxi/ridehail are more common.
Furthermore, lower income households are more likely to be transit dependent and lack access to a personal vehicle, which has equity implications as lower income households are much less likely to hold jobs that allow teleworking.
Use of Personal Vehicles for Activities After Using Transit for Work Commute Trips
After we identified commuters who used transit for work to home trips, we examined three key items: the frequency of weekday transit commuters who returned home and headed back out again, the purpose for trips by personal vehicle after transit commute trips, and travel activities after transit commute trips. We also looked at the activities of individuals who use transit for commute home by income level, presence of children in household, race, and gender. We found that:
- Over 28 percent of transit commuters go back out again after a transit commute home, and 19 percent go back out with a personal vehicle.
- Persons who go back out using a personal vehicle are about equally as likely to go shopping, have a meal, or participate in social/recreational activities.
- Persons from lower income households are more likely to use a mode other than personal vehicle for trips after a transit commute than those from higher income households. This suggests that lower income households are more dependent on other modes, such as transit or taxi/ridehail, to conduct daily errands.
- Persons from households with children are most likely to use personal vehicles for after transit trips, but few of those trips are for the purpose of shopping. This suggests that transit may not fully serve the needs of households with children to perform other types of activities such as daycare and recreational activities.
- Persons from households without children are the most likely to go back out after returning home from a transit commute, with nearly a third taking additional trips by any mode.
- Overall, only four percent of weekday commuters returning home by public transit head out again by personal vehicle to shop.
These findings suggest that nearly three in 10 transit commuters go back out again after they return home. They typically leave their home to go shopping, have a meal, or participate in social/recreational activities.
Lower income households are more likely to stay at home; and, if they leave their home again, it is most frequently for an activity other than a meal or shopping and not with a personal vehicle. This suggests that lower income households are more dependent on other modes, such as transit or taxi/ridehail, to conduct daily errands. These trips are often more costly and require longer travel times.
More from the Analysis
The key findings from the RTS in-depth analysis project will be delivered in a series of presentations to the TPB Technical Committee over the next few months. In addition to the three topics described above, eight additional topics were explored by the project and are also available for review online. We thank our TPB members and regional stakeholders who provided insightful questions for us to investigate further using the RTS data. The Planning Data and Research Team at TPB will continue to seek opportunities to better understand how travel behavior is evolving in our region.
All responses from the RTS in-depth analysis project are available here: https://www.mwcog.org/documents/2021/07/08/regional-travel-survey-in-depth-analysis/
Yu Gao, Ken Joh, Martha Kile, and Nicole McCall collaborated on the Regional Travel Survey In-Depth Analysis and serve together on the Planning Data and Research Team.