Over the years people have changed how they get around the region. The TPB’s Regional Travel Survey (RTS), provides an opportunity to see how the trends have changed over the decades.
About the survey
The RTS is a once-a-decade snapshot of regional travel patterns and how these patterns have changed over time. Unlike other TPB travel surveys, the RTS provides a comprehensive picture of all commute and non-work trips in the region, akin to a “transportation census.” As TPB’s largest and most significant data collection effort, the RTS is the primary input for the TPB travel demand model used for developing regional travel demand forecasts, and helps inform local and regional transportation planning decisions.
The TPB has conducted a regional household travel survey once a decade since 1968. The RTS had two parts: a recruitment survey, which captured demographic information and typical weekday travel, and a travel diary in which survey participants reported all household trips taken on a randomly assigned weekday. About 16,000 households completed both parts of the survey, well exceeding the survey goal of a representative sample of 15,000 households. Additionally, the RTS collected over 120,000 trip records from these households. The TPB staff reached a milestone by completing the post survey data processing and survey expansion. The public version of the RTS files is now available.
Now let’s look at a few interesting changes in travel behavior since the last survey in 2007/2008:
Bicycling has dramatically increased across the region, especially in the regional core.
Like many other metro regions, the greater Washington region has invested heavily in bicycle infrastructure by retrofitting streets with bike lanes and connecting multi-use trails, in addition to launching Capital Bikeshare in 2010. These investments appear to have paid off in terms of promoting more bicycling in the region. The share of all trips by bicycle doubled regionwide since 2007/2008, and increased three-fold in the region’s core including the District of Columbia, Arlington, and Alexandria. Share of daily walk trips, regionally, remained steady at about 9 percent.
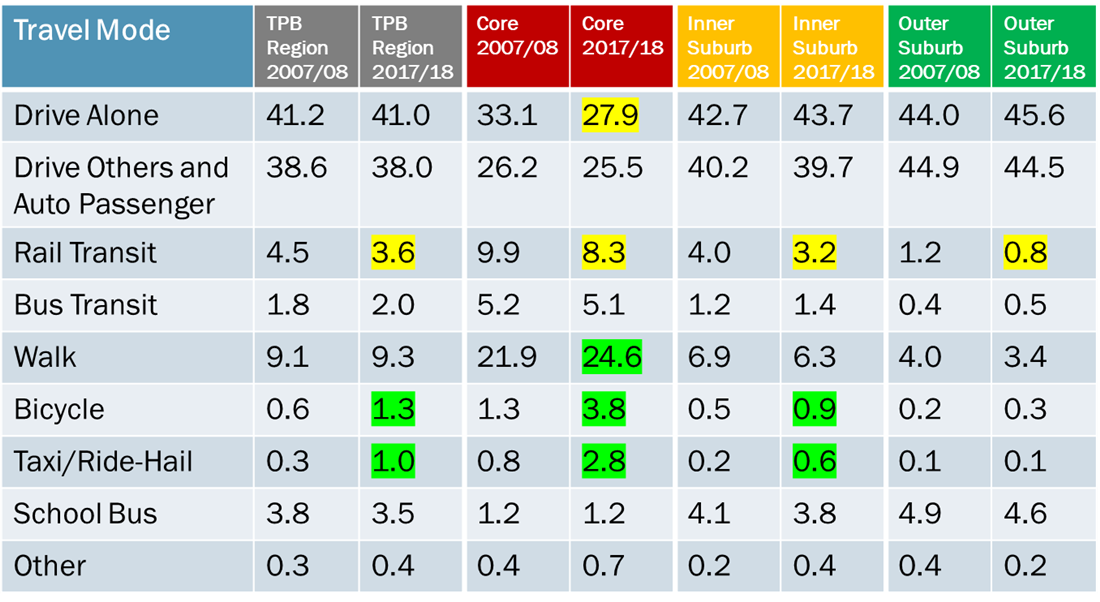
The chart above shows the changes in weekday travel modes. Bicycling has increased dramatically since 2007/2008. (TPB)
A decline in rail transit in the region, but bus transit remains steady.
The share of all trips by rail transit has declined in the region since 2007/08. This trend mirrors the decline in Metrorail ridership during this period. However, the share of bus transit trips did not decrease regionwide, and actually increased for commute trips. The drop in rail transit suggests that “choice riders” who have options other than transit are shifting towards other travel modes, while bus riders who tend to be more transit dependent still rely on bus transit services. The rise in bicycling and taxi/ride-hailing services also supports this trend.
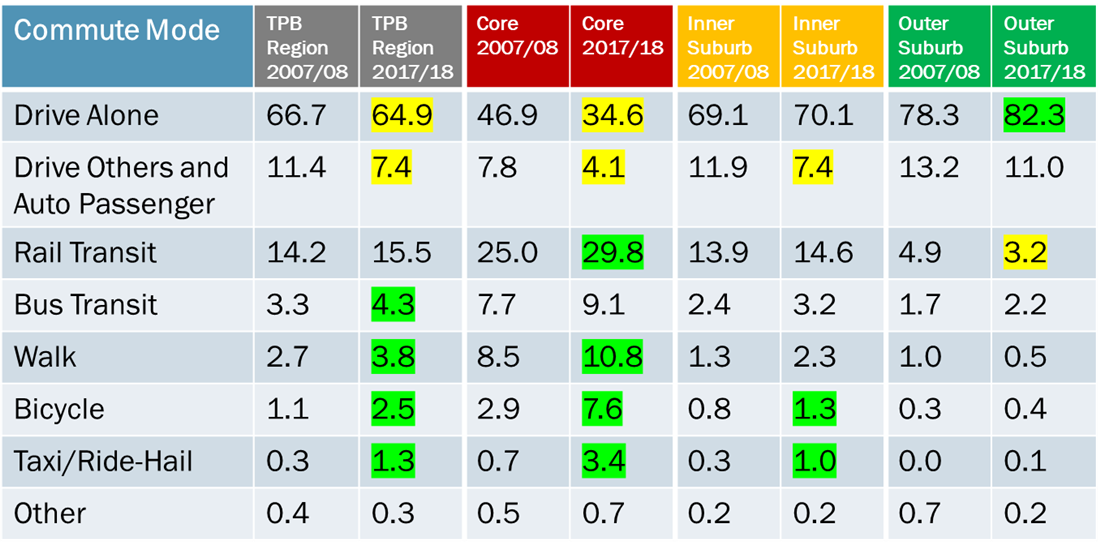
For commute trips, people are driving less. The chart above shows the change in travel modes for commute trips. (TPB)
People are driving less for their weekday commute
The share of commute trips by car (drive alone and carpool) has significantly decreased since 2007/08 in the region. More commuters are riding the bus, walking, biking, and taking taxi/ride-hail trips. This is primarily due to the overall changes in land use and development together with investments in transit and walk/bike infrastructure. The regional core experienced the sharpest decline in car commutes and the most significant increase in non-automobile commutes. Since 2007/08, the region has experienced increased development around transit stations and more housing near jobs which support commuting by non-auto modes. The arrival of micromobility and ride hailing services such as Uber and Lyft is also a contributing factor.
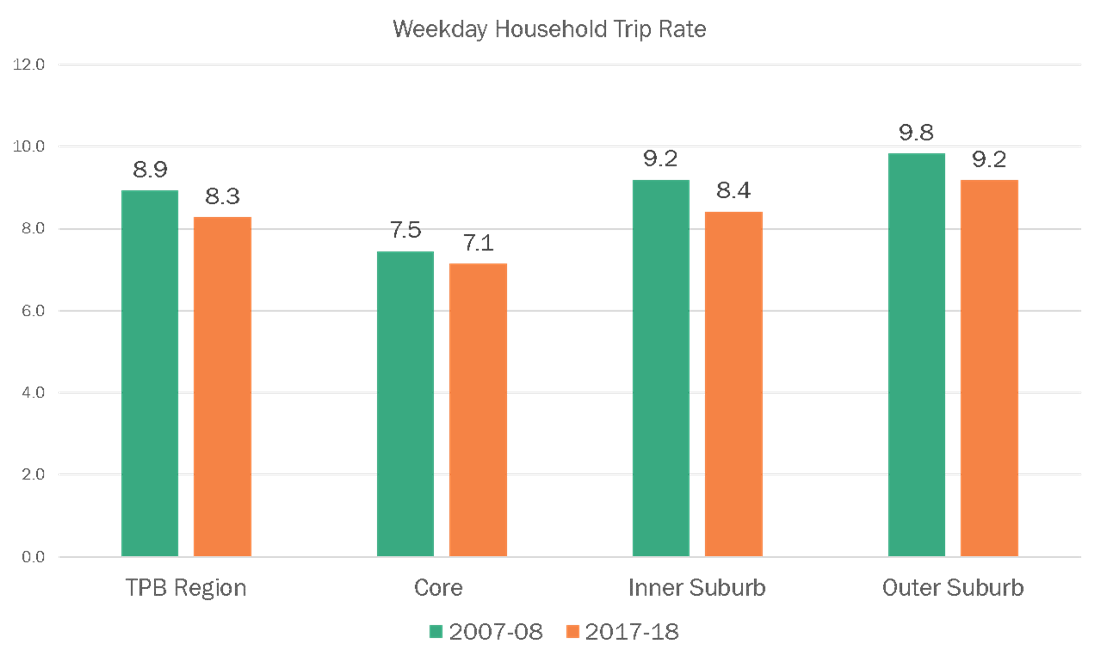
Households are taking fewer trips over all. The graph above shows the changes since 2007-08. (TPB)
Households were taking fewer trips in 2017/18
Households in the region were taking fewer trips overall compared with 2007/08, reflecting a nationwide trend in declining trip rates. The decrease in trips per household was slightly higher in the suburbs. This may be partially explained by the rise in online shopping and smartphone app-based delivery services such as Amazon and DoorDash replacing trips to stores and restaurants during the past decade. Even before the COVID-19 pandemic, people were already becoming more accustomed to having food and goods delivered to their homes.
Want to learn more?
These are just a few highlights comparing the new 2017/2018 data to the data collected 10 years earlier. We’ve also highlighted how the survey can help us think about transportation equity and some other interesting findings from the 2017/2018 survey. This data will be important for planners as our region recovers from the COVID-19 pandemic and it is time to plan for the future.
Read more: Four questions about the RTS
Read more: How does the TPB's Regional Travel Survey help us understand equity?
You can also find board presentations, other documents, and links to the Regional Transportation Data Clearinghouse for public files and selected tabulation at the RTS page.