The 2017/2018 Regional Travel Survey data show the ways that having access to many kinds of transportation options can impact people’s choices. Giving better access and opportunities to more people also has equity implications when looking at who has access to different modes of transportation and looking at where people live and how they get around.
About the Regional Travel Survey
As a reminder, the TPB conducts the Regional Travel Survey (RTS) once every 10 years to understand travel behavior and patterns throughout the Washington region. The survey had two parts: a recruitment survey and a travel diary. It gathered detailed demographic and travel information from 16,000 households based on a travel diary which respondents used to record every trip made by all household members on a randomly assigned weekday. These 16,000 households recorded more than 110,000 trips as part of the RTS. TPB staff have reached a milestone by completing the data processing of the travel diary information which provides a comprehensive glimpse of travel patterns in the region.
Learn more about the Regional Travel Survey.
Now that TPB staff analyzed the data from the travel diary portion of the survey, they also looked at travel patterns of various demographic groups and where people live. Comparing these different locations and how people of different races and ethnic groups and income levels get around allows decision makers in the region to consider where it may be important to invest in more transportation options.
The TPB has asked staff to consider racial equity in everything we do. Considering our region’s history of racial segregation, red-lining, and other restrictive housing and transportation policies that have influenced where people live up to the present day is important in looking at how data from this survey can be used. This kind of information can help decision makers in the region think about how race, location, income and transportation access can influence people’s daily lives.
Understanding Activity Centers and Equity Emphasis Areas
Within the TPB’s planning area, we have a few different ways of looking at the region’s geography. Two important geographies to understand are Activity Centers and Equity Emphasis Areas. Activity Centers are designated places in the region where people live, work, and play. They are often well-served by transit and include jobs, housing, and entertainment. They can be certain neighborhoods within the District of Columbia, or cities and towns in Maryland and Virginia. Activity Centers also tend to have a higher density of people and more mixed uses than other parts of the region. Equity Emphasis Areas are areas with a higher concentration of low-income and African American/Black, Asian, and Hispanic/Latinx populations compared to the region as a whole. TPB planners use these areas to study whether TPB plans and programs may have a disparate impact on these communities by comparing Equity Emphasis Areas to the rest of the region. These two designations are not mutually exclusive as an Activity Center could also be located in an Equity Emphasis Area but these geographies are helpful to understand TPB research.
How do people travel in Activity Centers and Equity Emphasis Areas?
According to the survey, Equity Emphasis Areas and Activity Centers both had higher rates of rail and bus riding, walking, biking, and ride hailing. Households in Equity Emphasis Areas take fewer trips on average than households outside of Equity Emphasis Areas. This could be partly explained by household income and race/ethnicity which we will look at later in this post.
Households in Activity Centers take fewer trips on average than households outside of activity centers. This suggests that the lower trip rate may be partially due to fewer vehicle trips since activity centers tend to be more compact and mixed-use. Remember that there may be overlap between Activity Centers and Equity Emphasis Areas since they are not mutually exclusive.
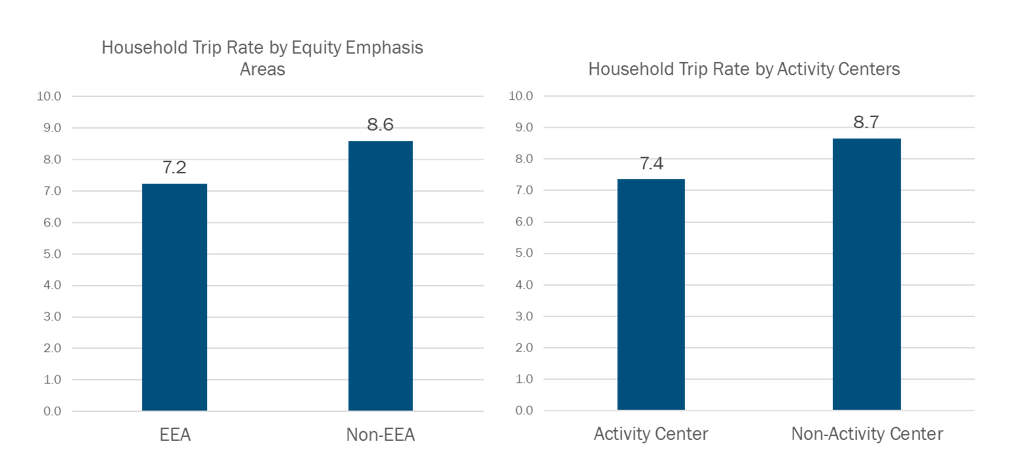
Equity Emphasis Areas and Activity Centers both had higher rates of rail and bus riding, walking, biking, and ride hailing. (TPB)
How does income impact access to transportation?
We looked at where people live but we can also see differences in the kinds of transportation options and choices people of different income levels make. Knowing that Equity Emphasis Areas have higher concentrations of people with low incomes, how does income influence how many trips a household takes? The number of daily household trips, also known as the household trip rate, increases with household income. Higher income households take more trips while lower income households take fewer trips on average. This is to be expected since higher income households generally take more discretionary trips.
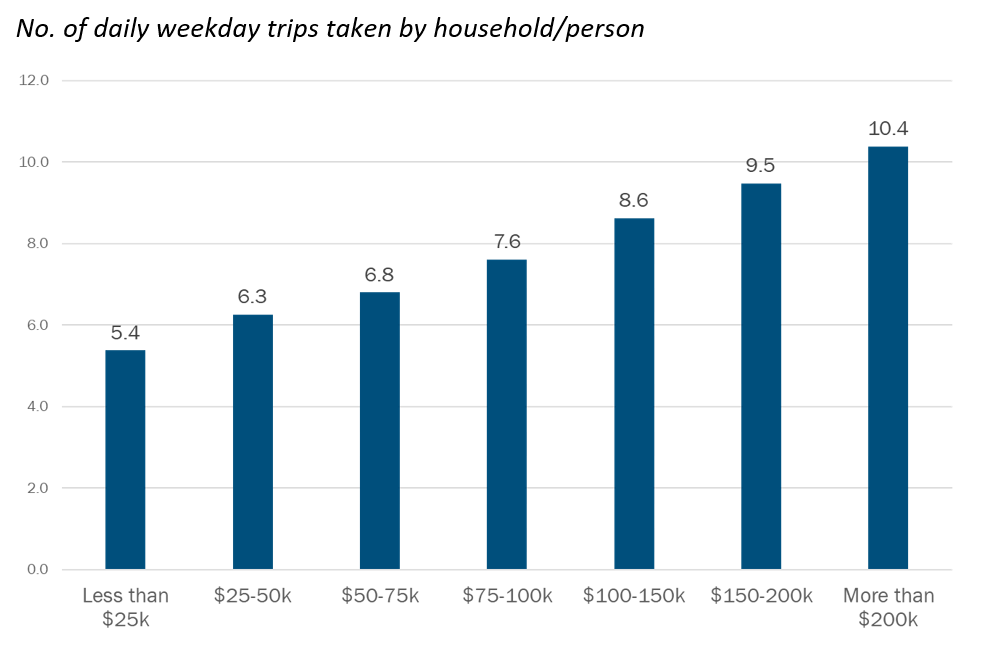
Higher income households take more trips while lower income households take fewer trips on average. (TPB)
Lower income households, especially those under $25k, are less likely to drive and more likely to walk or take the bus to work. Bus riding has been traditionally associated with lower income groups, a finding that has been shown in other studies.
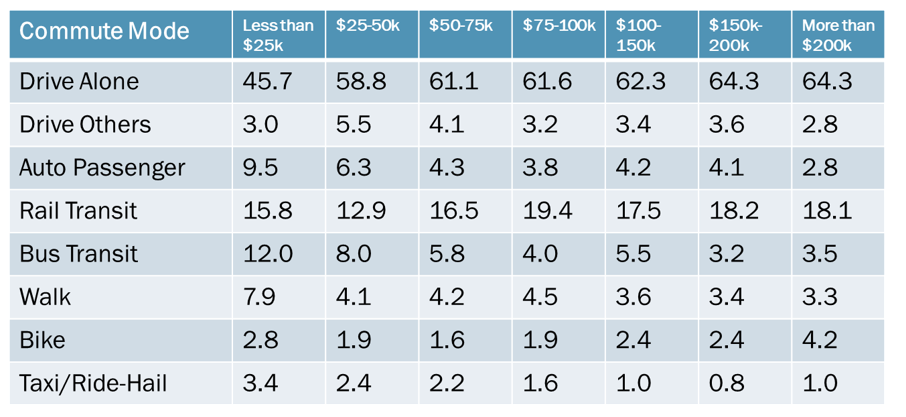
Lower income households are less likely to drive. (TPB)
And how does race impact access to transportation?
Now that we looked at income, how do people of different racial groups travel? Non-Hispanic whites take significantly more trips on average than other racial and ethnic groups. This may be partially related to income, particularly with Black and Hispanic/Latinx people who tend to have lower incomes. Cultural factors and/or immigrant status may also explain some of these differences. However, the RTS did not ask questions about immigration status.
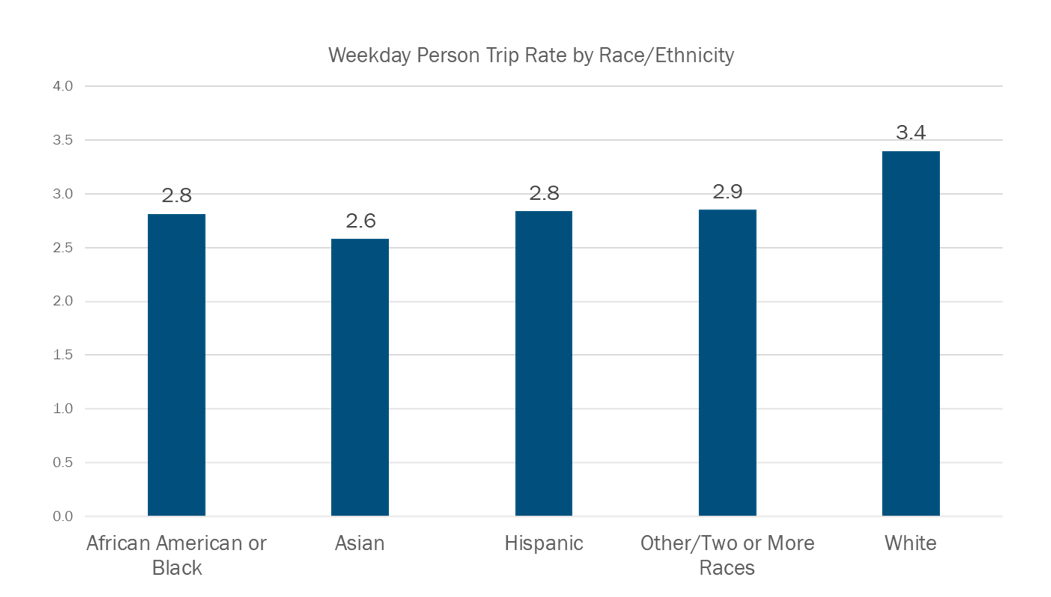
Non-Hispanic whites take more trips than other racial and ethnic groups. (TPB)
We also know that the household trip rate can also depend on how many household vehicles are available. Households with cars take more trips than households without cars. Having a car available is also associated with household income and race/ethnicity. Non-Hispanic whites have access to more household motor vehicles (0.72) than other racial/ethnic groups, even after normalizing for household size. Additionally, as household income increases so do the number of motor vehicles. The highest income households have greater access to household vehicles than lower income households.
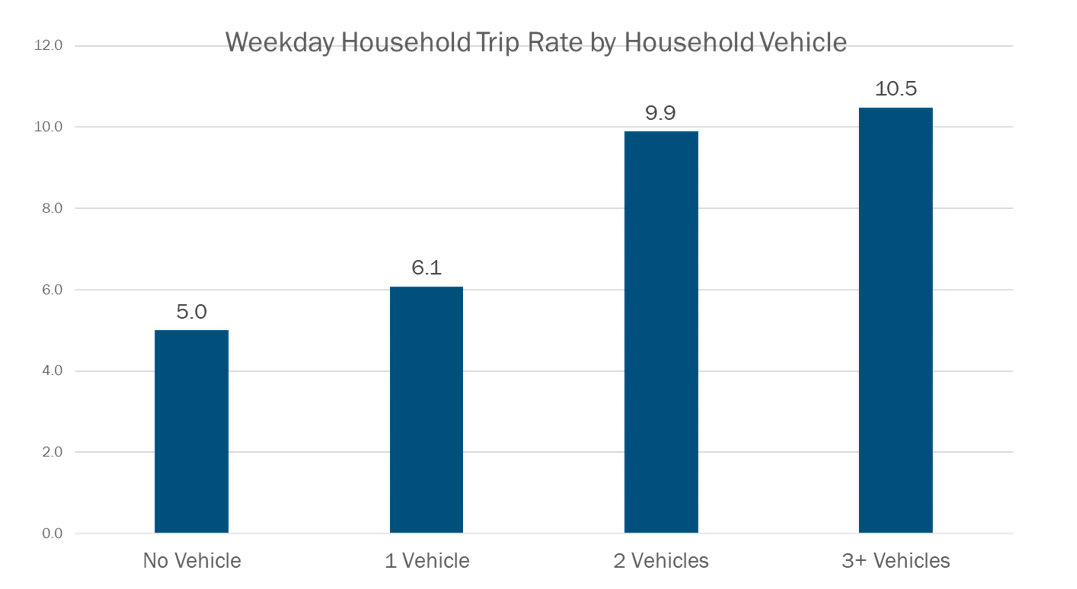
Households with more vehicles take more trips (TPB)
Hispanics/Latinx and African American/Blacks are more likely to take the bus to work. Non-Hispanic whites are more likely to drive alone or ride a bike to work. Like income, bus riding has been traditionally associated with minority groups, particularly among Hispanics/Latinx and African American/Blacks. Other empirical studies have supported this finding.
The RTS gives us a picture of how people were getting around prior to the COVID-19 pandemic. It provides helpful guidance for long-range planning decision makers in the region. By looking at the different ways that racial groups and people with low-income get around we can see how access to different kinds of transportation options can impact how easily people can use those options. The Equity Emphasis Areas are one way we can use geography to locate transportation options in areas where people need the most access to more choices.
Learn more about the Regional Travel Survey.
Ken Joh contributed to this article.