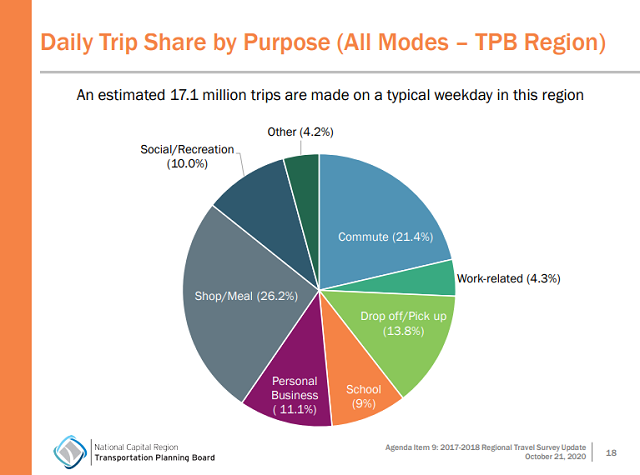
The National Capital Region Transportation Planning Board’s (TPB) once-in-a-decade Regional Travel Survey offers a detailed look at the 17.1 million trips—commute and non-commute—taken on a typical weekday in metropolitan Washington, including information on travel mode, origin, and destination.
Although the survey of nearly 16,000 area residents was conducted pre-COVID, it provides the most recent and comprehensive picture of travel in the region.

“Since 1968, the Regional Travel Survey has provided area leaders with a better understanding of area residents’ travel patterns, helping us respond to the transportation needs of our communities,” said Kelly Russell, TPB Chair and City of Frederick Alderman. “This survey data, as well as our ongoing analyses of travel during the pandemic, will be integral to helping our region plan for the future.”
MORE: Regional Travel Survey Briefing: Initial Findings of Observed Daily Trips
Who is Traveling: Trips by Household and Person

The survey revealed that more weekday trips were taken by larger households, those located in the outer suburbs, those with higher incomes, those containing more workers, and those with multiple vehicles. Households without children took slightly more trips on average than those with children after controlling for household size.

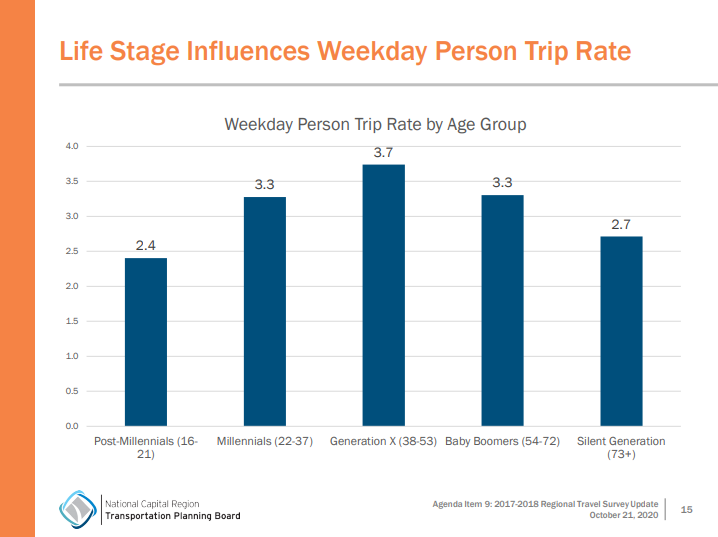
On an individual level, Generation X (persons aged 38-53 in 2018) took more trips on average than other age groups. Post-millennials (persons aged 16-21 in 2018) took fewer trips on average than other age groups.
How They’re Traveling: Mode
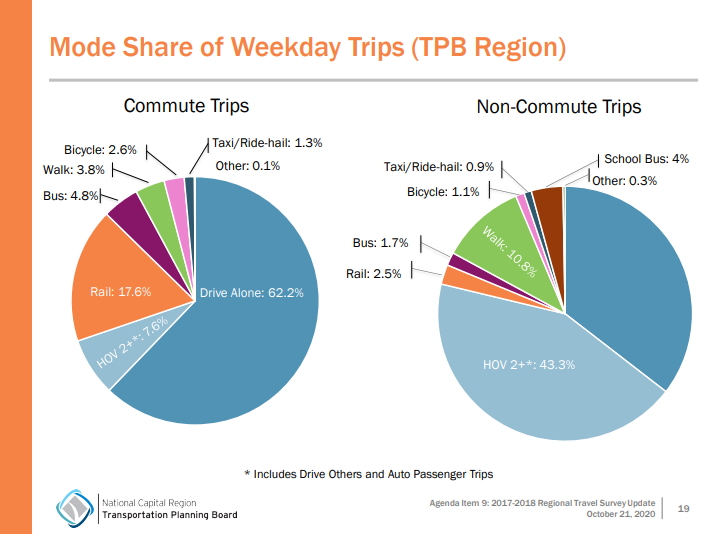
The majority of all trips regionwide are taken by private automobiles including single-occupancy vehicles (SOV) and vehicles with two or more passengers (HOV 2 ).
And, while the majority of the region’s overall commute trips are SOV trips, more than one-third of the region’s commute trips are non-SOV, with nearly one-quarter comprising bus and rail trips.

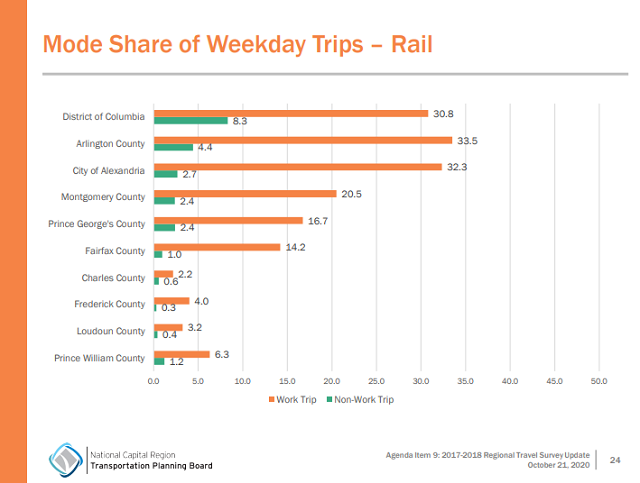
Overall, the highest shares of bus, rail, walk, bicycle, and taxi/ride-hail trips are taking place in the region’s core, while the outer suburbs have the highest shares of automobile trips.

Shares of non-automobile modes are also higher in regional activity centers, locations that will accommodate the majority of the region’s future growth, and equity emphasis areas, which are generally higher density, mixed use, and more demographically diverse, and critical to equity-focused analysis.
In December, the TPB will be briefed on changes in observed travel between the 2007/2008 survey and most recent 2017/2018 survey.
About the Survey
The Regional Travel Survey has been conducted approximately every ten years since 1968, and collects demographic and travel information from a randomly-selected representative sample of households in the region and adjacent areas. It is the primary source of observed data used to estimate, calibrate, and validate the region’s travel demand model, which is used for developing elements of the region’s long-range transportation plan, Visualize 2045.
MORE: TPB News: 4 questions about the TPB's Regional Travel Survey