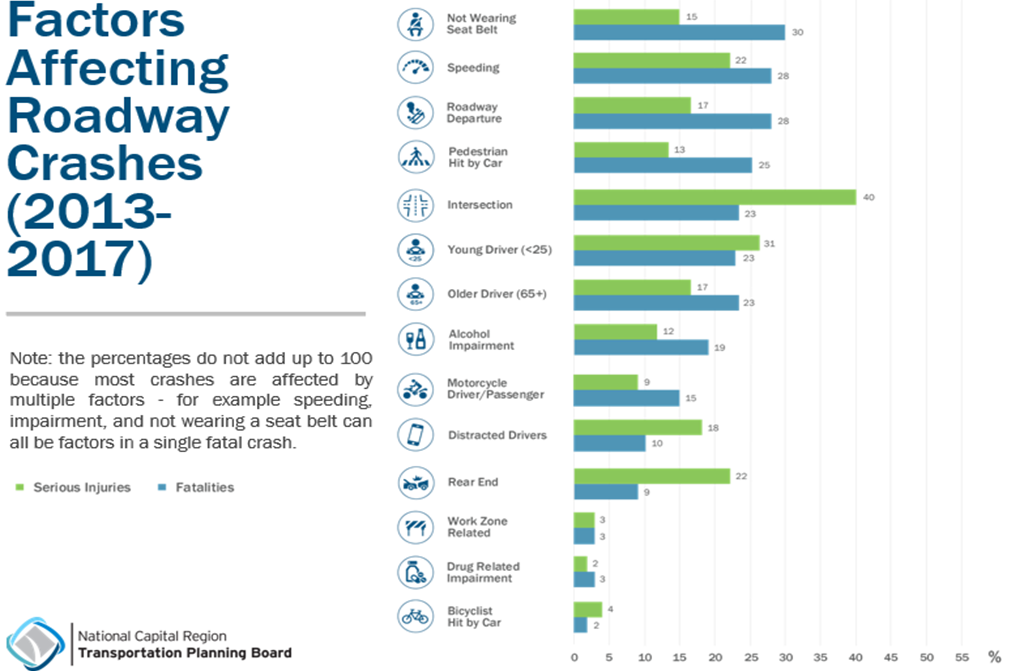
The initial results of the Regional Safety Study are in. People not wearing seat belts was the number one contributing factor in fatal crashes between 2013 and 2017. In fact, 30 percent of fatal crashes in our region involved someone not wearing their seat belt. Twenty-eight percent of fatal crashes involved someone speeding and the same percentage of fatal crashes involved a vehicle leaving the roadway. This last example is of two factors being related in that someone driving too fast is more likely to run off the road. The third most common type of fatal crash occurred when a driver hit a pedestrian – this was a factor in 25 percent of the fatal crashes in the region. Many other factors contributed to fatalities and serious injuries such as intersection-related crashes, crashes involving young drivers, crashes involving older drivers, and crashes where the driver was impaired by alcohol.
In addition to looking at the factors contributing to crashes, it’s also helpful to look at crash types and roadway functional class.
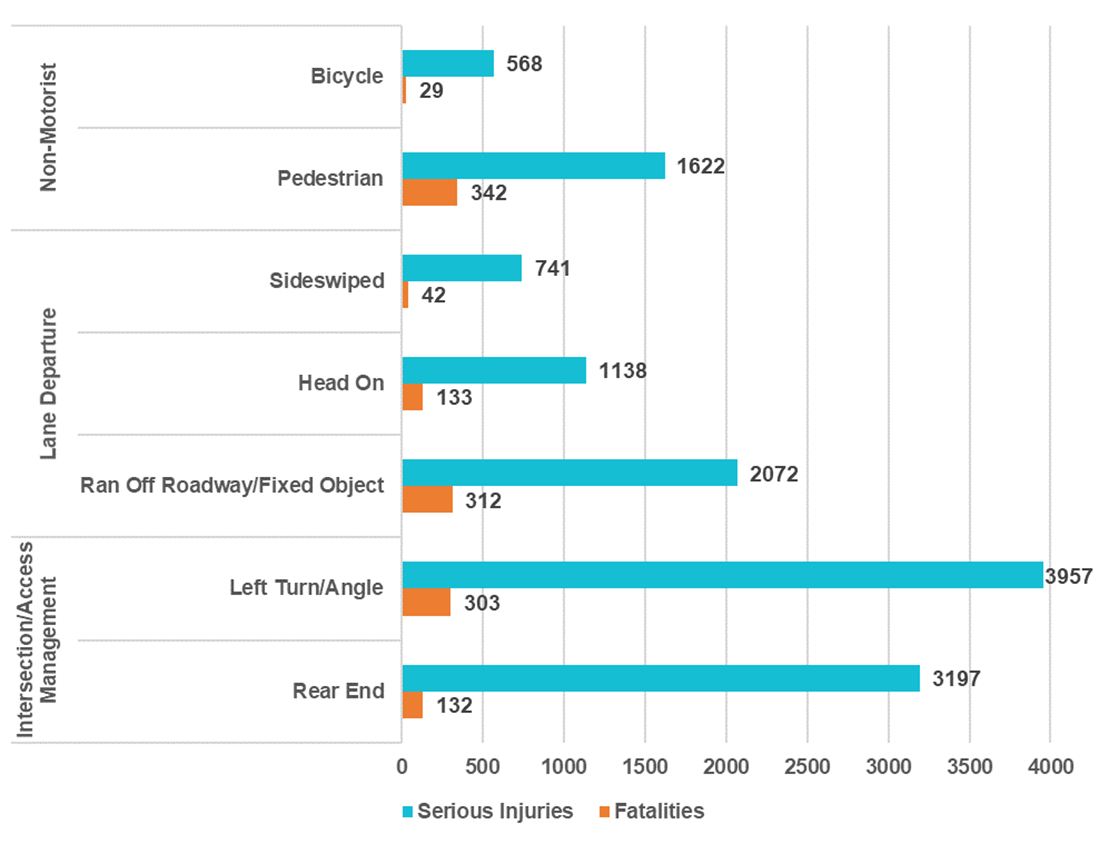
Take a look at the graphic below. It illustrates the three main crash types: crashes with non-motorists, lane departure crashes, and crashes related to intersections. When looked at this way, the top three crash types that resulted in fatalities were; 1) crashes between vehicles and pedestrians, 2) crashes where a vehicle left the roadway and hit a fixed object, and 3) crashes that involved a vehicle making a left turn at an intersection. When combining fatalities and serious injuries, crashes at intersections (both left turn and rear end) are the most frequent type of crash.
Crash Types (2013-2017)
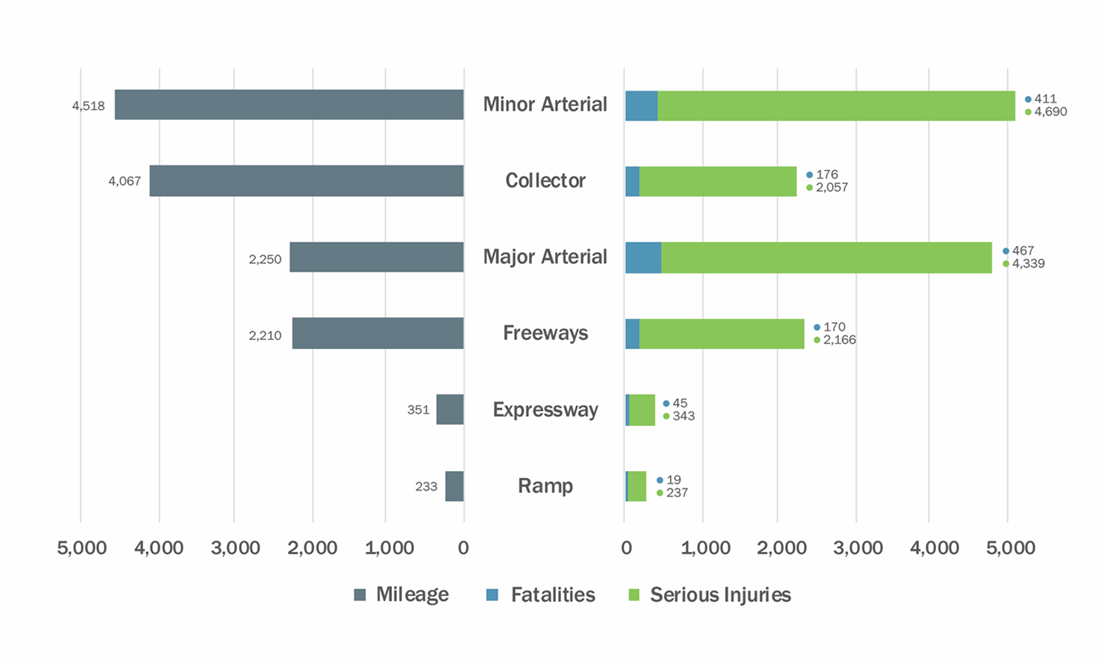
Now let’s look at the types of roadways where crashes took place. The next graphic compares the number of lanes miles for each class of roadway in our region (on the left) with the number of fatalities and serious injuries that occurred on those roadways between 2013 and 2017 (on the right). The two classes of roadway with the most fatalities and serious injuries are minor arterials and major arterials. Each of these roadway classes have a similar number of fatalities and serious injuries, but there are far fewer lane miles of major arterials than there are of minor arterials. This means that on a per lane mile basis, more fatalities and serious injuries occur on our region’s major arterials than on any other class of roadway.
Roadway Functional Class (2013-2017)
The crash data allow us to look more deeply into any of the contributing factors, crash types, or roadway classes and to look at any number of combinations of factors, but such analyses are limited by funding availability. Within the budget allocated for this study, there is funding available for three “deep dives” into the data. Based on the initial analysis of our region’s crash data, TPB staff, in consultation with safety officials from the Virginia Department of Transportation, the District Department of Transportation, and the Maryland Highway Safety Office, directed the consultant team to dig deeper into crashes between vehicles and pedestrians, crashes at or near intersections, and crashes along major arterials. The results of these “deeper dives” will be presented to the TPB at their May 20, 2020 meeting.
The TPB commissioned this consultant-led study to better understand the factors contributing to fatal and serious injury crashes in the region, to determine where crashes on the roadway transportation network are over-represented, and to recommend effective solutions (projects, programs, and policies) that the TPB or its member jurisdictions can implement to reduce fatalities and serious injuries on our roads. In June, the study team and staff will provide a set of recommendations for the TPB to review and consider. These recommendations are currently under development and will be based on the crash data analysis, including the deeper dives.
Please remember, while governments at all levels have important roles to play in improving safety on our roadways, everyone in our region can do something to save lives. The following are traffic safety tips from COG's Street Smart campaign.
If you’re driving:
- Slow down and obey the speed limit.
- Stop for pedestrians at crosswalks.
- Be careful when passing buses or stopped vehicles.
- When turning, yield to people walking and biking.
- Look for bicyclists before opening your door.
- Allow at least 3 feet when passing bikes.
- Avoid using your cell phone and never text while driving.
If you’re walking:
- Cross the street at the corner and use marked crosswalks when they’re available.
- Use the pushbuttons.
- Wait for the walk signal to cross the street.
- Watch for turning vehicles.
- Before crossing, look left, right, and left again.
- Be visible. Wear something light or reflective after dark.
- Watch out for blind spots around trucks and buses.
- Avoid using your cell phone while you’re crossing the street.
- On an off-street trail, obey all posted signage and approach intersections with caution.
If you’re biking:
- Obey signs and signals.
- Never ride against traffic.
- Ride in a straight line at least 3 feet from parked cars.
- Use hand signals to tell drivers what you intend to do.
- Wear a helmet.
- Use lights at night and when visibility is poor.
- On an off-street trail, obey all posted signs and approach intersections with caution.