The 2019 Washington-Baltimore Regional Air Passenger Survey (APS) showed that customer parking has declined at the Washington-Baltimore region’s airports in recent years, with 2019 seeing a significant drop compared to 2017. As more people have traded in their personal vehicles for ride hailing companies like Uber and Lyft — and airports try to make up the difference in lost revenue by ramping up airport concessions sales — we take a closer look at how much air passengers spent on their trip to the airport, and during their time at the airport.
In late April 2020, the TPB will release an initial set of findings from its most recent Washington-Baltimore Regional Air Passenger Survey (APS), conducted in October 2019. The 2019 APS was the fourteenth in a series of regional air passenger surveys conducted since 1981. The survey gathered data from more than 23,000 departing passengers at the region’s three major commercial service airports: Baltimore-Washington International/Thurgood Marshall (BWI), Ronald Reagan Washington National (DCA), and Washington Dulles International (IAD). The survey, conducted every two years, helps local planners and airports better plan for traffic, parking, and how people get to and from the airports. While this latest survey does not capture the travel slow down due to the COVID-19 virus, the data will be helpful in the future as people return to travel.
The survey asked air passengers about their travel preferences, why they were traveling, how they got to the airport, and how much they spent – both on their trip to the airport, and during their time at the airport. Our findings reveal that while most people have still been using a private vehicle to get to the airport, more people have used ride hailing services and fewer people have been parking at the airport. Fewer people parking at the airport may mean less revenue for the airports. It also may mean that air passengers have been spending less on their trips to the airport.
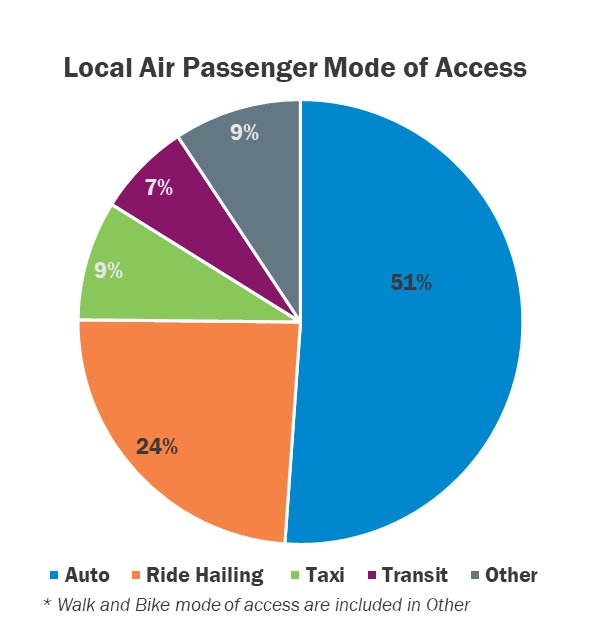
As the pie chart indicates, over half of all air passengers traveled to the airport by a personal vehicle or a rental car, while 24 percent used a ride hailing service. Smaller portions of air passengers traveled by taxi, public transit, courtesy shuttle, walking, or biking.

Source: Washington-Baltimore Air Passenger Survey General Findings Report 2019 (TPB)
MORE: Read the full 2017 Washington-Baltimore Regional Air Passenger Survey General Findings Report
New questions for 2019: Carpooling, Walking, and Biking
For the first time, the 2019 survey asked those who took a private vehicle, rental car, taxi, or ride hailing service if they carpooled to the airport – and nearly a quarter of them did. While 38 percent of carpoolers traveled by private car, 34 percent used a ride hailing service. The vast majority – 63 percent – of those carpooling traveled for non-work related reasons.
For the 2019 survey TPB staff also added “walk” and “bike” as mode choices. Few respondents said they walked or biked to the airport, but based on these limited responses, non-work travelers are almost three times as likely to walk to the airport than work travelers. For these new questions it will be interesting to see if trends begin to emerge in the future.
Airport parking is declining across the region
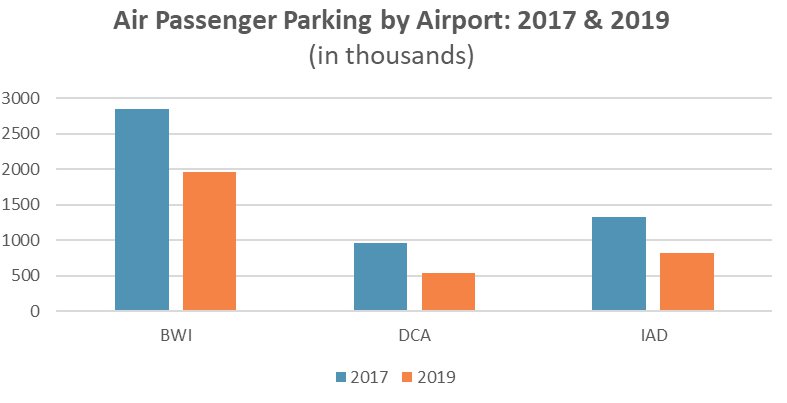
So, what about parking? Fewer people have been parking at the three airports, which could pose challenges for parking revenue streams at the region’s three major airports. In 2019, only 10 percent of departing air passengers parked at the airport – a significant decline from 19 percent in 2017. As the bar graph demonstrates, in 2019 air passenger parking decreased at all three airports: BWI, 31 percent; DCA, 44 percent; IAD, 39 percent.

Source: Washington-Baltimore Air Passenger Survey General Findings Report 2019 (TPB)
How much did people spend to get to the airport?
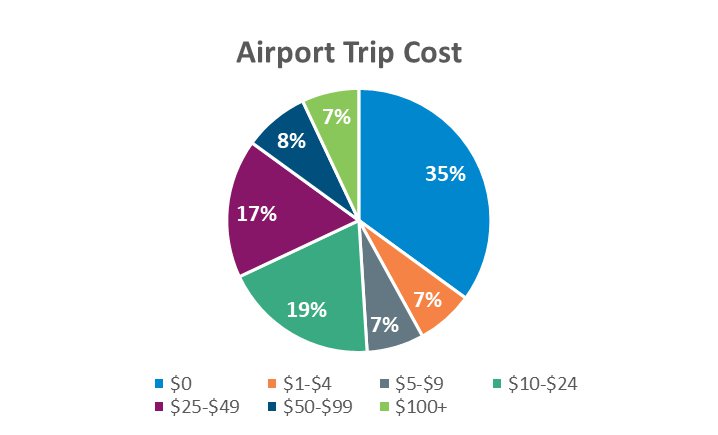
So, fewer people have been parking at the airport, but how much did they spend to get to the airport? The pie chart provided shows how much passengers spent on their trips to the airport. While 35 percent of air passengers reported spending nothing on their trip to the airport, 77 percent of those individuals traveled to the airport by private vehicle.
Of the seven percent of overall air passengers who spent $1 - $4, private vehicle travel accounted for 47 percent and Metrorail to DCA accounted for 35 percent. Over half of those who spent $5 - $9 traveled by private car. The largest proportions of travelers who spent $10 - $99 used a ride hailing service. Of those who spent $100 or more, 71 percent traveled by rental car.

Source: Washington-Baltimore Air Passenger Survey General Findings Report 2019 (TPB)
Airport Concessions Spending
So, we covered spending to get to the airport, but how much did people spend while they waited for their flights? Overall, 23 percent of air passengers did not spend money at the airport, while most spent between $1 - $24. Those spending more than that were more likely to spend more time at the airport. The more time they spent at the airport, the more money they spent.
So, what does this tell us?
Current declines in global air travel aside, the 2019 Washington-Baltimore Regional Air Passenger Survey General Findings Report tells us three things about airport ground access: air passengers have been parking at the airport less, they have been traveling by ride hailing companies more, and ride hailing trips have been making up the bulk of ground access spending. While it is too early to claim any correlation or causation between airport concessions spending and airport ground access behavior, subsequent surveys may provide more insights into airport revenue generation.
Until next time
Later this year TPB will release the 2019 Washington-Baltimore Regional Air Passenger Survey Geographic Findings Report which will reveal new findings and recurring trends about how air passengers travel to the three airports. Stay tuned for more details. And in October of 2021, the TPB will conduct its biennial air passenger survey once again. Will the region’s air passengers continue their decline in airport parking? Will increased spending at the airport make up the difference? Will ridesharing vehicles be used by more air passengers than ever, or might there be a resurgence in public transit ridership? Time will tell. Stay tuned for the latest in regional air passenger trends from the Washington-Baltimore Regional Air Passenger Survey on TPB’s Continuous Airport System Planning website.
The TPB conducts its Regional Air Passenger Survey every two years to help airport officials, and local, state, and regional planners understand what improvements need to be made to maximize the benefit the region's airports bring to the people who live and do business here. The survey gathers data from over 23,000 departing air passengers at Baltimore-Washington International/Thurgood Marshall (BWI), Ronald Reagan Washington National (DCA), and Washington Dulles International (IAD) airports.
Arianna Koudounas is a transportation planner for the TPB. She serves long-term regional transportation planning efforts, including co-managing the biennial Regional Air Passenger Survey and overseeing a multimodal range of technical studies.