TPB staff have reached a milestone by completing data collection for the once-in-a-decade Regional Travel Survey. The survey gathered detailed demographic and travel information over the course of a year from nearly 16,000 households across the region. As the TPB’s largest and most significant data collection effort, this survey provides a comprehensive and regional glimpse of travel patterns and provides critical input for forecasting future travel patterns and vehicle emissions. Since the last survey in 2007/2008, the region’s mobility landscape has transformed with the rise of smartphone apps and other technological changes, which were captured in the survey for the first time with new questions on these emerging trends.
A survey in two parts
The Regional Travel Survey is a two-part survey. The first part is a recruitment questionnaire, which asks about household characteristics in addition to new questions on alternative travel options that reduce the need for solo driving, such as ride-hailing and bikeshare. The second part is a travel diary in which participants record every trip made by members of their household on their assigned weekday such as school, work, errand, and recreation trips. TPB staff have begun analyzing the results from the first part of the survey and will release data from the travel diary by Spring 2020.
Here are a few takeaways from the initial results:
More people in the region’s core said they order deliveries and use ride-hailing apps
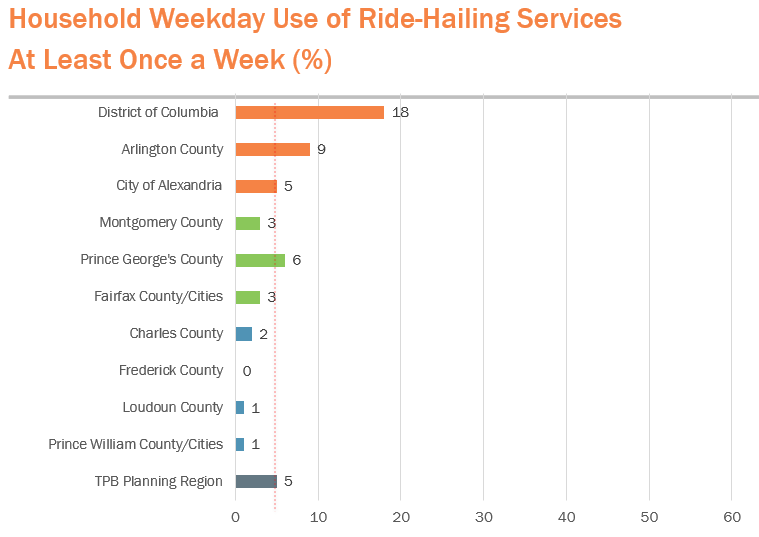
Ten years ago, ride-hailing wasn’t even a term and Uber was just getting started. These services arrived in the metropolitan Washington region in 2011 after the TPB’s last regional household travel survey. For the first time, the survey asks respondents how often they used ride-hailing services like Uber and Lyft. The data shows that ride-hailing is most frequently used in the regional core, especially in the District of Columbia, where nearly one in five D.C. residents use ride-hailing services at least once a week. Additionally, nearly one in 10 residents in Arlington County use services like Uber and Lyft once a week, twice the region’s average of five percent.
Another new phenomenon is the rise of delivery services from everything from food to packages. These deliveries have dramatically changed how often people need to travel for shopping or food. As e-commerce sales continue to grow, home delivery services will continue to play a pivotal role in the region. The survey found that one in three households in the region received a home delivery on any given weekday, whether it is a package, food, or other home delivery service.
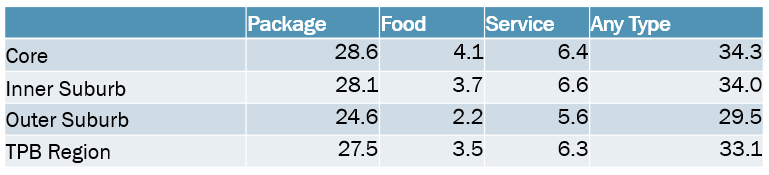
The region's core includes the District of Columbia, Arlington County, and the City of Alexandria. The Inner Suburbs include Montgomery County, Prince George's County, and Fairfax County and Cities. The Outer Suburbs include Charles County, Frederick County, Loudoun County, and Prince William County and Cities. (TPB)
The survey exceeded its target goal of 15,000 households
The survey was successful in collecting a representative sample of households across the region, exceeding the target goal of 15,000 households. This number surpasses previous surveys of this kind, and is one of the largest regional household travel surveys in the U.S. In addition to meeting the regional target, the survey response met the target number of respondents for every jurisdiction in the region. TPB staff took steps to promote participation across the region, including a special outreach effort to Hispanic and Latino communities with the help of CASA de Maryland. This coordinated effort helped to ensure that participants across the region had an opportunity to provide valuable input on their daily travel, painting a detailed picture of travel patterns across the greater Washington region.
More results to come
The TPB’s Regional Travel Survey is an enormous logistical and statistical undertaking. Over the next year, TPB staff will present key findings from these data to the TPB and its technical committees. Staff are interested in learning what questions member jurisdictions want to ask and what our region can learn from the survey data.
MORE: Learn more about the Regional Travel Survey