How many new jobs will come to the D.C. area in the near future? What types of neighborhoods are employers seeking to move into? Which industries are growing the fastest? The answers to these questions impact millions of residents around the metropolitan Washington region. Forecasting economic growth trends helps residents, businesses, developers, and local governments prepare for and adapt to changes.
The Metropolitan Washington Council of Governments (COG) annual Commercial Construction Indicators Report is one of many sources of information local planners and governments use to track regional economic trends. The report analyzes trends in non-residential projects that have been completed in metropolitan Washington, including office, retail, industrial, healthcare, religious, educational, utility, and some government properties, and looks at factors such as the number, location, structure type, and size of new development projects.
This year’s report found three key findings:
Regional commercial construction shows slow growth
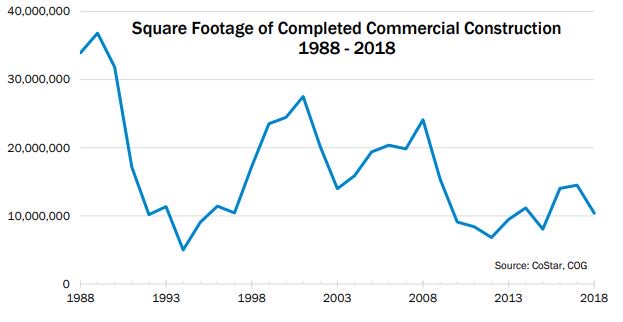
Commercial construction continued at a modest pace in 2018, adding 144 office, retail, industrial, or other commercial buildings with a total of 10.4 million square feet of new space.
Commercial construction in the region declined sharply between 2009 and 2012, after the dual impacts of the Great Recession and federal budget sequestration. In 2012, new construction fell to 6.8 million square feet—its lowest total in 18 years. Since then, the pace of building has increased slowly and unevenly. The 2018 total represents a 52 percent increase from the 2012 low, but is 28 percent lower than the 14.5 million square feet of commercial space added to the region in 2017.

Office construction improves
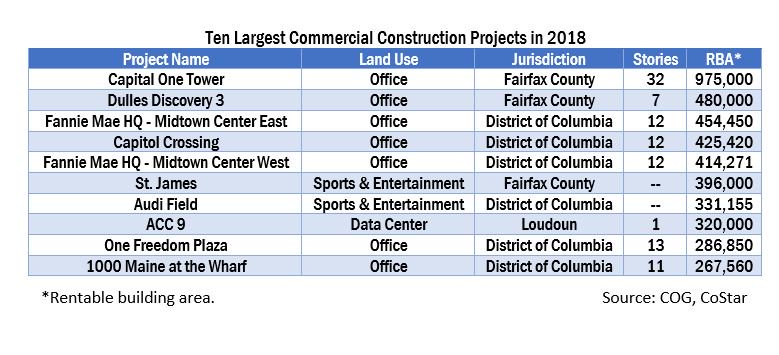
Construction in the office sector grew for the third straight year in 2018. Seven of the region’s 10 largest commercial projects in 2018 were office buildings, including the Capital One Tower in Tysons Corner. The 32-story office tower is the tallest occupied building in the metropolitan Washington area.

Office employment is the main driver of the regional economy. Office construction experienced a nine-year slump from 2007 to 2015. This period of low office construction coincided with high office vacancy rates. Since 2015, however, annual office space construction has grown by 162 percent and the office vacancy rate has dropped from 14 percent to 12.9 percent.
Construction near transit stations increases
Much of the recent office development has clustered around Metrorail stations and central city neighborhoods. Forty-four percent of new commercial space was built within a half-mile of one of the region’s 91 Metrorail stations in 2018; 82 percent of that was office space.
COG monitors growth around transit-oriented and mixed-use neighborhoods. In 2013, the COG Board approved 141 such communities, called Activity Centers, around the region. The COG Board’s Region Forward vision set a target of 75 percent of new commercial construction to be within one of these Activity Centers. In 2018, 78 percent of new commercial space—and 98 percent of new office construction—was sited within an Activity Center.
COG will continue to monitor commercial construction trends and other leading indicators of economic activity. The trends highlighted in this year’s report signal the real estate market is preparing for moderate employment growth in the region with new employers seeking space around Metrorail stations and in city centers. Private sector investment like Amazon’s HQ2 in Arlington demonstrate metropolitan Washington’s national competitiveness. Increasing office construction and falling vacancy rates point to the possibility of more robust job growth in the region’s future.
MORE: View the full Commercial Construction Indicators Report.
John Kent is a Regional Planner in the Community Planning and Services Department at the Metropolitan Washington Council of Governments.