On your way to work, do you ever look around and wonder where everyone else came from and where they are on the way to? While having your teeth cleaned have you considered where your dentist might live? And, what about his or her assistant? Or, why is it so difficult to find a skilled crafts person to refinish a piece of furniture? COG has developed a mapping application that begins to answer some of these questions and offers valuable information for officials as they make future planning decisions.
Discussions about the region’s economy often focus on what is produced, how many people are employed, and an industry’s contribution to the regional economy; however, behind each job is an individual who returns to his or her personal life at the end of the day. Where they live, out of choice or necessity, affects our region’s ability to recruit talent and secure the services that we need.
The National Capital Region Transportation Planning Board (TPB) recently endorsed seven initiatives with the potential to improve the region's transportation system for its new long-range transportation plan, Visualize 2045. One initiative involves bringing jobs and housing closer together to allow more people to walk to work and use transit, reduce congestion, and make driving more reliable for those who commute by car.
A first step to determine how to bring jobs and housing closer together involves understanding existing job and residential patterns. Who currently lives near their jobs and who lives further away? How is talent clustered? What links exist between where our talent works and lives? These patterns can help to inform us about how land use, transportation, and housing policies, among others, impact where our region’s workers live.
Below are seven job and residential patterns from COG’s interactive Residential Patterns of Metropolitan Washington’s Talent map:
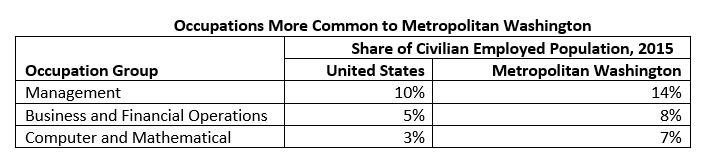
1. Most Common Occupations: For years, our region’s economy has been driven by three main industries – Professional and Business Services; Government Services and Enterprises; and Financial Activities. These industries tend to hire individuals working in Management, Business and Financial Operations, and Computer and Mathematical occupations, making these occupations more common in the metropolitan Washington region than the rest of the nation.
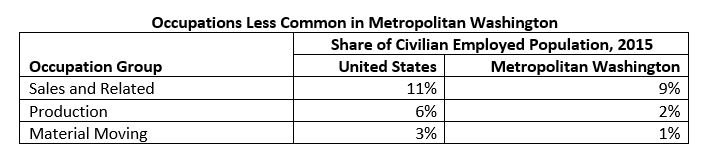
2. Least Common Occupations: You will find fewer individuals working in Sales and Related, Production, and Material Moving occupations. So, back to the question about finding a skilled craftsperson: if you are having a challenging time finding someone to refinish your furniture, it is partially because the occupation group this talent belongs to, Production, makes up six percent of the civilian employed population across the nation, and only two percent in the metropolitan Washington region.
3. Impact of Income: Housing affordability frequently influences how talent is distributed across the region. While doctors, chiropractors, and dentists report to the same offices as their assistants and aides, it is likely that they live in completely different parts of the region. Individuals in Healthcare Practitioner and Technical occupations are compensated at rates above the region’s average ($90,000 for Healthcare Practitioner and Technical occupations versus $65,900 for all occupations in 2015) and are distributed across the region in proportion to the civilian employed population. In contrast, one in five individuals in Healthcare Support occupations, whose annual average income was $35,700 in 2015, live in Prince George’s County, where housing tends to be more affordable.
However, this does not hold true for all major occupation groups. Workers in the two lowest paying major occupation groups in 2015 (Personal Care and Service at $31,100 and Food Preparation and Serving at $25,500) live throughout the region. Individuals in these occupations may be opting to reduce their housing costs by living with multiple roommates, so they can be closer to work and avoid otherwise costly commutes.
4. Proximity to the Region’s Core: Fifteen percent of the civilian employed population is located in the region’s core. Two major occupation groups are geographically concentrated in the District of Columbia, Arlington County, and the City of Alexandria: Legal occupations (39 percent); and Arts, Design, Entertainment, Sports, and Media occupations (30 percent). On average, these major occupation groups are paid above the region’s average, which provides individuals more flexibility to live closer to their place of work and cultural amenities.
5. Life, Physical, and Social Science Occupations: Nearly half of the region’s Life, Physical, and Social Science talent is concentrated in Montgomery County and the District of Columbia along the I-270 Bio-Corridor. Thirty-one percent of those employed in this occupation group reside in Montgomery County.
6. Computer and Mathematical Occupations: Our region has more than twice the nation’s rate of Computer and Mathematical talent. Every jurisdiction in the region has a greater rate than the nation, but particularly high shares of this talent are found in Fairfax County (23 percent), Loudoun County (11 percent), and the City of Falls Church (10 percent).
7. Agricultural Occupations: Individuals supporting our regional agricultural systems are rare. Individuals in Farming, Fishing, and Forestry occupations make up only 0.1 percent of the civilian employed population in the metropolitan Washington region. Eleven percent of this talent resides in Frederick County. However, only 0.5 percent of Frederick’s civilian employed population works in this major occupation group.
MORE: View map showing where individuals in different major occupations groups live.
Notes: COG staff used U.S. Census Bureau, 2011-2015 American Community Survey 5-Year Estimates to derive share of employment by occupation and jurisdiction. Annual mean wage estimates are from the Bureau of Labor Statistic’s Occupation Employment Statistics May 2015 estimates for the Washington-Arlington-Alexandria, DC-VA-MD-WV Metropolitan Statistical Area.
Nicole McCall is a senior regional planner at the Metropolitan Washington Council of Governments.