We have recently seen news coverage of poor air quality in cities including Beijing, New Delhi, Milan, Paris, and Tehran. Bad air quality has prompted the cities to take a mix of actions to clean the air, including closing schools and businesses and placing limits on driving. This prompts the question, how are we doing in the metropolitan Washington region?
The type of air pollution causing the recent concerns around the world is the amount of fine particles, referred to as PM2.5, in the air. This is a measure of particles as small as 2.5 microns, or just 1/10,000 of an inch. These particles are too small for our respiratory systems to filter out, and end up being trapped in our lungs. The very smallest pass through peoples’ lungs into the blood stream and can damage the heart.
These fine particles come from sources such as power plants, factories, cars and trucks, unpaved roads, wood burning and agriculture. More information on fine particles and air pollution in the Washington and Baltimore region is available at Clean Air Partners.
So, how does the metropolitan Washington region compare to other international cities?
Beijing and Metropolitan Washington Comparison
One recent article showed the history of air quality in Beijing, China from 2008 through fall of 2015. The article compiled data measuring the amount of fine particles in the air from the U.S. Embassy in Beijing and showed that 80 percent of the days in this time range had unhealthy air quality. In comparison, the metropolitan Washington region had less than one percent of the days in this time range with unhealthy levels of fine particles in the air.
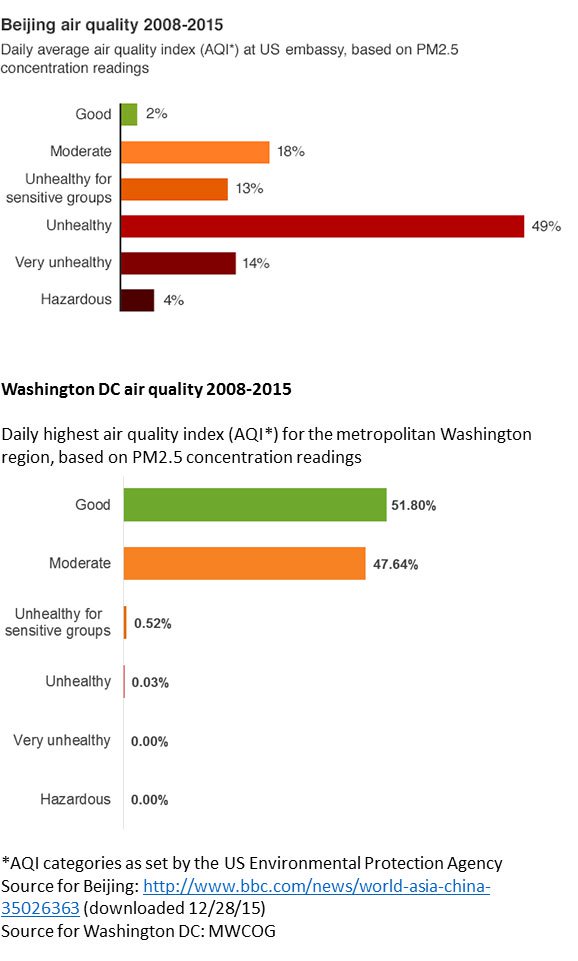
- Beijing DC PM 2.5 Comparison (Credit: BBC, COG)
Historic Air Quality Levels in Washington
In the not so distant past, the metropolitan Washington region had to deal with serious air pollution issues. A report, Air Pollution in the National Capital Area, issued by the federal Public Health Service of the Department of Health, Education and Welfare (Public Health Service Publication No. 955, July, 1962) showed the average suspended particulate pollution in Washington, D.C. to be 132 micrograms (ug)/m3 from 1953-1959.
A pilot study of air pollution by the District of Columbia Department of Public Health and the federal Public Health Service showed 24-hour particulate matter concentrations reading ranging from 134 to 272 ppm Mg/m3 from December 2-8, 1960.
A third Public Health Service study from November, 1967 showed the arithmetic mean particulate concentration from 1958 to 1966 ranged from a high of 143 micrograms/m3 down to 77 micrograms/m3 in 1968.
These are nearly as high as the highest readings found in the most polluted international cities today.
And as recently as 2005, the U.S. Environmental Protection Agency (EPA) said our region was not meeting its fine particle pollution standards. This meant pollution levels were too high and that area leaders, through the Metropolitan Washington Air Quality Committee at the Metropolitan Washington Council of Governments, needed to devise a plan to clean the air.
Fine Particle Pollution around the World
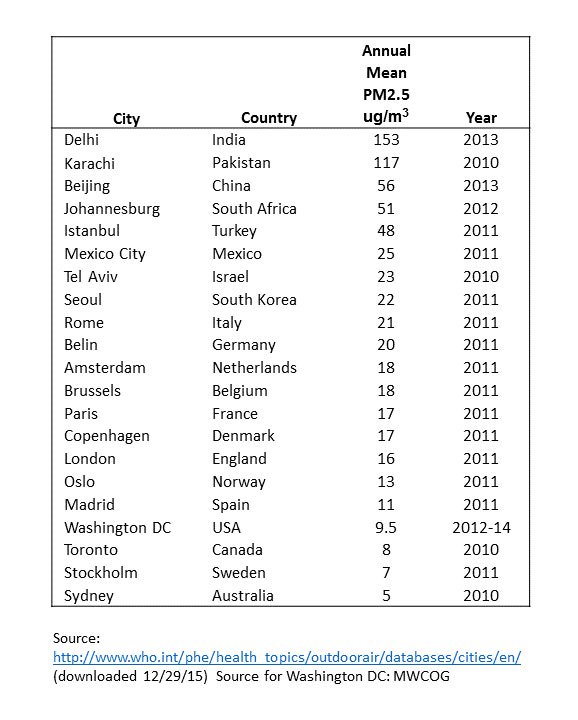
Another way to look at fine particle pollution is its annual mean level. The World Health Organization publishes data showing the levels of this pollution for major cities around the world.
Data shows the metropolitan Washington region as one of the cleanest cities in the world. The region’s average annual fine particle value for the region over 2012-2014 was 9.5 micrograms/m3. Only three of the 20 cities sampled below had lower annual PM2.5 values.
Why is the metropolitan Washington region’s air quality now cleaner than most other major cities around the world?
The states and local governments in the District of Columbia, Maryland, Virginia, as well as the federal government have put in place many controls on emissions of fine particle pollution. These include actions such as tighter controls on power plant pollution, tighter vehicle engine emission controls, switching to cleaner burning gasoline and diesel fuels and heating oils, vehicle anti-idling policies, and a ban on open burning.
In October 2014, the EPA approved re-designating the region as in compliance with the federal standard for controlling fine particle pollution—a major accomplishment for regional leaders.
Looking Forward – Still More to Do
While metropolitan Washington can celebrate success in cleaning up fine particle pollution, we still have work to do on another major challenge--reducing the level of ozone pollution. Ground level ozone pollution, commonly referred to as smog, can cause shortness of breath, coughing, wheezing, headaches, chest pain, and eye and throat irritation. Ozone pollution is caused by release of volatile organic compounds and nitrogen oxides from sources such as power plants, factories, cars and trucks, paint, and aerosol products.
Ozone levels in the metropolitan Washington region have been getting lower-- in 2015, we recorded just five days when the region’s air quality exceeded healthy levels for ground-level ozone. In 1998, there were 67 such days. But our ozone levels have not been consistently low enough to be assured the region will be able to meet the latest health-based standards.
So, as 2016 starts, we can celebrate having cleaner air in the metropolitan Washington region, and resolve to continue to take the needed actions to further improve our air quality and protect the public health.
David Snyder serves as chairman of the Metropolitan Washington Air Quality Committee at COG. He is a City of Falls Church Council Member.