Analysts at the TPB have examined hour-by-hour traffic patterns on area roadways during the first four “safety surges” of Metro’s aggressive, yearlong SafeTrack maintenance program. The analysis reveals some noteworthy impacts that could help traffic management agencies, transit providers, employers, and daily commuters plan for future disruptions.
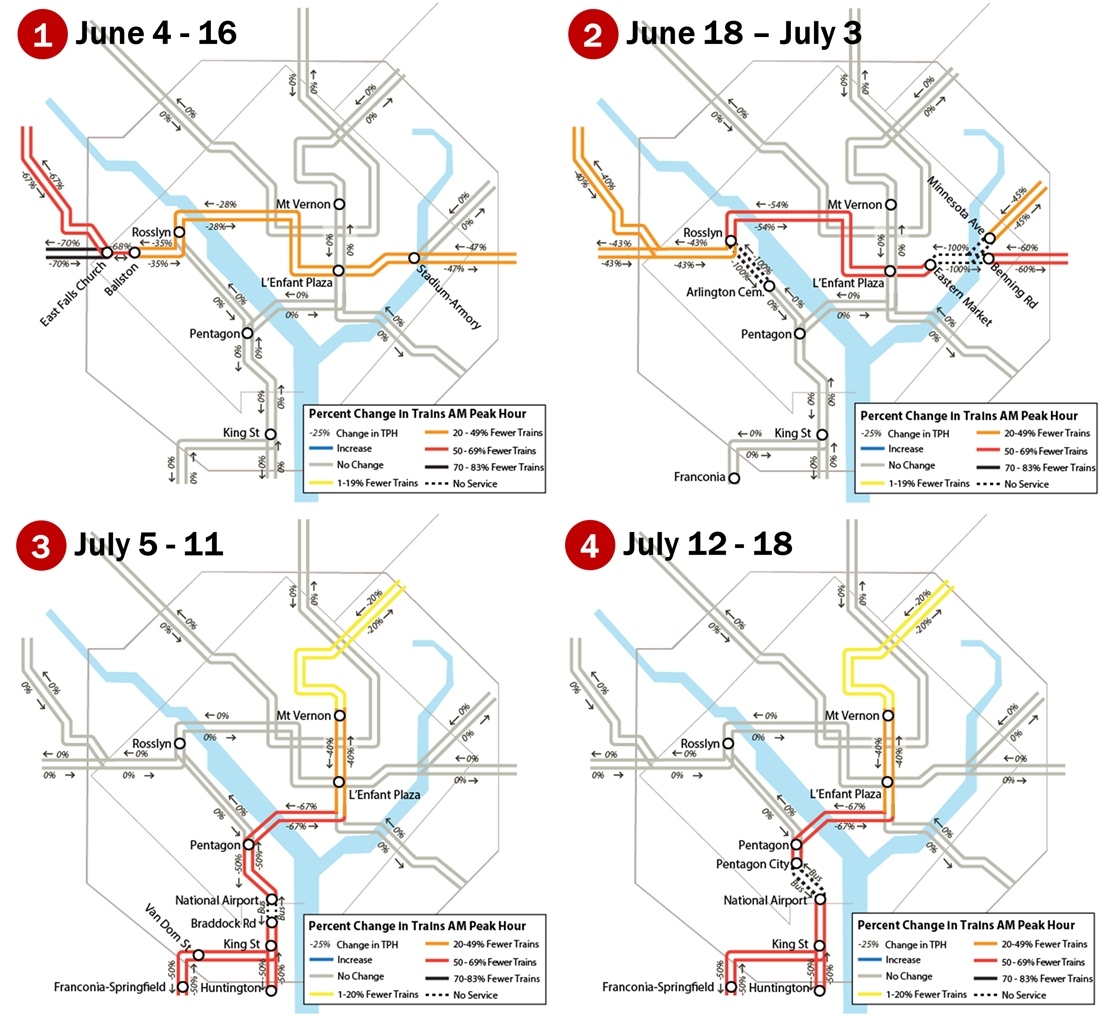
The TPB’s recent analysis looked at traffic patterns during each of the first four SafeTrack safety surges (see below). Metro estimates that 30-40% of daily trips were impacted by the service disruptions during each of the surges. Bus bridges and increased local and express bus service helped carry some of the displaced trips. Commuters were also encouraged to find carpool partners, bicycle, or walk, or to telework and avoid traveling altogether.
Each of Metro's first four SafeTrack safety surges impacted 30-40% of daily trips. (WMATA)
To understand the traffic impacts of SafeTrack, the TPB’s analysts compared average hour-by-hour traffic conditions during each safety surge to conditions during the same time last year. The analysis focused on weekdays and looked mainly at freeways, since these are the times and locations most likely to see increased traffic congestion.
Here are the highlights of the TPB's SafeTrack traffic analysis:
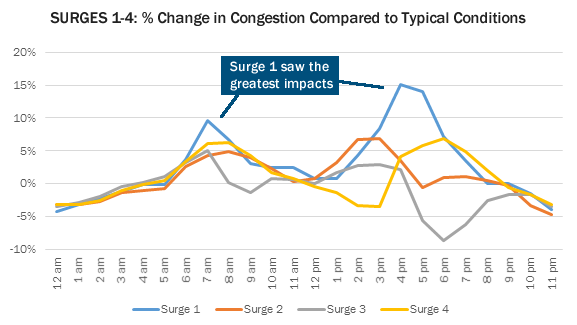
> Surge 1 saw the most pronounced increases in traffic
Traffic during each of the first four surges tended to be worse than the same days in 2015, but Surge 1 saw the greatest impacts. Travel times on freeways were about 10% higher on average during the morning commute, and about 15% higher during the afternoon commute. During Surges 2, 3 and 4, the impacts were much lower, and arterial roadways saw an average increase of less than 3%.
Traffic during each of the first four surges tended to be worse than the same days in 2015, but Surge 1 saw the greatest impacts. (TPB)
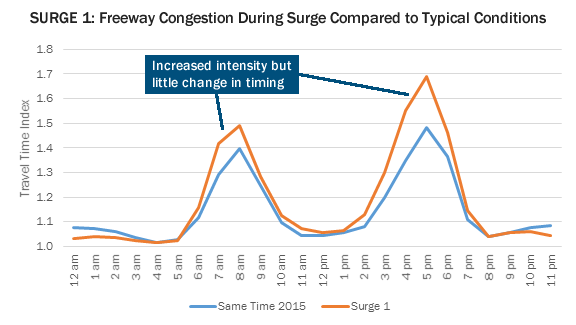
> The timing and intensity of traffic during peak commuting times shifted in response to all four surges
Surge 1 saw an increase in the intensity of traffic during the morning and afternoon commuting times and a slightly earlier start to traffic during both periods. Surge 2 saw little change in the intensity of traffic but saw the afternoon commute pick up 1-2 hours earlier than usual. Surge 3 saw little change in morning commute patterns but saw lower-than-normal afternoon traffic and an earlier end to the afternoon rush. Surge 4, like Surge 1, mostly saw an increase in the intensity rather than timing of peak traffic.
Surge 1 saw an increase in the intensity of traffic during the morning and afternoon commuting times and a slightly earlier start to traffic during both periods. (TPB)
These shifts suggest two different kinds of traffic impacts. More intense peak period traffic suggests more driving than usual, while shifts in timing suggest that travelers adjusted their behavior in response to the real or perceived effects of the maintenance work.
> The most significant impacts were concentrated in the vicinity of each SafeTrack work zone, but downtown DC consistently saw worse-than-normal traffic
The greatest traffic impacts occurred where one would expect them: near, upstream or downstream of, or on alternate routes parallel to the affected line or lines. During Surge 1 this was especially clear, with portions of I-66, VA-267, and the George Washington Parkway all seeing travel-time increases of 100% or more during the morning commute. Surge 4 also saw particularly significant impacts, mainly along US-1 and the George Washington Parkway near Reagan National Airport, and also along I-395.
Every time period studied also showed a concentration of travel time increases of 30% or more on many routes in downtown DC. This suggests that each of the surges so far has consistently led to an increase in driving in the downtown core.
MORE: Find all the maps in the full technical analysis
> Traffic impacts were lower during Surges 2, 3, and 4, but the cause is not yet known
Surge 1 by far brought the greatest traffic impacts to area roadways, with Surges 2, 3, and 4 showing much less significant effects. Several potential factors could be responsible. One is that the details of each surge are different, with different impacts to different travelers in different parts of the region with different alternatives available to them. Another is that as more people in the region became aware of SafeTrack and its potential traffic impacts, they adjusted their travel times to avoid peak commuting times or chose alternatives other than driving.
A third potential contributing factor is routine summertime changes in travel patterns. In the past, the TPB has consistently found that travel delay drops about 15-20% during summer months when schools and Congress are out and more people have greater flexibility in their travel schedules. Traffic agencies and travelers should be aware of this heading into SafeTrack surges that will coincide with the end-of-summer jump in traffic that usually takes place in September.
* * *
The TPB’s analysis can help area traffic management agencies improve their strategies for managing back-ups caused by major disruptions. Travelers, too, can use the information to better plan their trips and avoid the worst impacts. The analysis also sheds light on the region’s resilience to disruptions, Metro’s role in the region’s transportation system, and how transit agencies and others might plan for future shutdowns or service disruptions.
* * *
MORE: Find more charts, graphs, and key takeaways in the full technical analysis
MORE: Metro's full SafeTrack work schedule